


Introduction
Auditory brainstem response (ABR) has been used since the early 1970s to estimate hearing thresholds and to identify disorders of the central auditory nervous systems. Since then, there have been substantial efforts to improve the ABR spectral neural synchrony by simultaneously activating the whole basilar membrane to improve its signal to noise ratio (SNR) [1,2]. Among these efforts include the works by Dau, et al. [1] who first introduced the chirp stimulus based on the linear cochlear model [3] and expanded the earlier concept of a stimulus with rising sweeps in frequency by Shore and Nuttall [4] when recording compound action potential.
Dau, et al. [1] designed the upward rising chirp stimuli to overcome the issues of the lower frequencies phase cancellation in the ABR to the click stimulus. In the upward rising chirp stimuli, the onset of the low-frequency signals is adjusted to appear before the high-frequency signals to compensate for the traveling wave delay of the low-frequency signals. This adjustment allows for all frequency signals to arrive at the cochlear at the same time, thus obtaining a maximum temporal synchronization. The ABR from the upward rising chirp stimuli has several advantages, including a larger Wave V amplitude in comparison with the ABR to the click stimulus especially at lower and mid-intensity levels [5,6], high correlation with pure tone audiometry, and better threshold estimations than the ABR to the click stimulus [6,7]. It can also save time in assessing newborns if high stimulus rates with an objective detection analysis are used [8].
Despite this success, the traditional upward rising chirp stimuli have been reported to have poor representation of Waves I and III, even in normal hearing subjects [5]. There was also a reduction of Wave V amplitude at high stimulation levels compared to the ABR to the click stimulus. This is probably due to a mismatch between the slow onset of the upward rising chirp stimuli at high-intensity levels with Wave I and III neural fibers that discharge at a rapid rate [9]. Elberling, et al. [10] evaluated the upward rising chirp stimuli with different stimulus durations and intensity levels on ten normal-hearing adults. The authors found that the rising chirp with a shorter stimulus duration is suitable for high-intensity level presentation to avoid the upward spread of excitation. In contrast, at lower and mid-intensity levels, a longer rising chirp stimulus duration is needed because the potentially restricted region of the cochlear will be excited. From this study, upward rising chirp stimuli that are dependent on the stimulus levels are proposed and termed as a level-dependent chirp or level-specific CE-Chirp® [11].
Unlike the traditional ABR with upward rising chirp stimuli, the ABR LS CE-Chirp® can produce the earlier ABR waves (I and III), and later wave (V) with a larger amplitude than the ABR to the click stimulus at both the lower and high-intensity levels [12-14]. Due to this, it was proposed as a tool for neurological diagnosis for determining lesions around the central auditory nervous system [14]. Before the ABR to the LS CE-Chirp® stimulus can be used clinically for either neurological diagnosis or threshold seeking, knowledge on its reliability must be established [15]. Regarding ABR, its reliability can be obtained by measuring the consistency of the repeated ABR recordings during the same session or between different clinical sessions. This will provide the tester with a high level of confidence that they are accepting the correct ABR waves as opposed to incorrectly accepting noise [16].
There is scant evidence on the test-retest reliability of ABR to the LS CE-Chirp® stimulus. Contrastingly, the test-retest reliability has been well studied in the ABR recorded to the click stimulus [17-19] and has been investigated in a single study using a traditional rising chirp stimulus [20]. Previous studies on test-retest reliability results from ABR to the click stimulus revealed that the ABR results in normal hearing subjects can be consistently recorded within the same session and between different clinical sessions separated by a few days and up to two years [17-19, 21-23]. Cobb and Stuart [20] is the only study that investigated the test-retest reliability using the traditional upward rising chirp stimuli on thirty healthy newborns. In the study, the ABR test-retest reliability was assessed at the same clinical session with multiple intensity levels. Cobb and Stuart [20] found significant correlations in the air and bone conduction ABR Wave V amplitudes and latencies from the traditional upward rising chirp stimuli between the repeat ABR waveforms at multiple intensity levels.
To the author’s knowledge, there are no known studies that have sought to determine the test-retest reliability using LS CE-Chirp® . Therefore, this requires further investigation. Previous literature findings concerning the ABR test-retest reliability using other stimuli (e.g., click and CE-Chirp® or traditional chirp) may not apply to the ABR to the LS CE-Chirp® stimulus, because of the different potential findings obtained when using this stimulus. The advantages of the ABR to the LS CE-Chirp® stimulus suggest at least similar, if not better test-retest reliability results than the ABR to other stimuli (click and CE-Chirp®). Thus, the present study aims to investigate the test-retest reliability of the ABR to the LS CE-Chirp® stimulus in normal-hearing adult subjects at multiple intensity levels.
Subjects and Methods
Selection of participants
Eleven normal hearing adult subjects (five males and six females) aged between 18 and 25 years participated. This study received ethical approval from the International Islamic University Malaysia Research Ethics Committee (approval code: IREC 2018-279). Written informed consent was obtained from all of the subjects. The study participants met the inclusion criteria, which were: no significant abnormalities in the ear canal and tympanic membrane based on otoscopic examination, normal hearing with a threshold of ≤20 dB across frequencies (250 Hz to 8,000 Hz) based on a pure tone audiometry test, no middle ear problems (Type A tympanogram) and no other otological problems.
Study participants underwent preliminary tests that included an otoscopic examination, tympanometry, acoustic reflex, and pure tone audiometry. Those with the flu or a fever for at least 2 or 3 days before the clinical session were excluded from this study to avoid the presence of conductive elements. All the subjects were invited to return for another test session, which was scheduled one to two weeks after the first assessment (7 to 13-day interval). During the second session, the same preliminary tests were carried out to check for any changes in their audiological findings.
Methods
The ABR was performed in a sound treated-room located at a hearing and speech clinic. The experiment was conducted using a two-channel Interacoustic Eclipse ABR system. The participants had Nu- prep skin preparation gel applied on four skin areas: the high forehead, lower forehead, and right and left mastoids. Ambu Neuroline 720 (Ambu A/S, Ballerup, Denmark) disposable electrodes were then placed on the scrubbed area, where the non-inverting electrode was placed on the high forehead, inverting electrodes were placed on the right and left mastoids, and the ground electrode was placed on the lower forehead. The individual electrode impedance was maintained below <3,000 Ω with almost equivalent inter-electrodes impedance.
The ABR was elicited using a standard 0.1 ms click ABR (spectrum of 0.2-11 kHz) and commercially available LS CE-Chirp® (spectrum of 0.2-11 kHz) stimulus presented through the Eclipse ER-3A (Etymotic Research, Inc., Elk Grove Village, IL, USA) insert phone at 19.1 Hz, on the right ear using rarefaction polarity. The acoustic calibration was maintained following the reference-equivalent threshold sound pressure level of ISO 389-6:2007 for the click stimulus and Physikalisch-Technische Bundesanstalt (PTB; National Metrology Institute of the Federal Republic of Germany, Braunschweig, Germany) for the LS CE-Chirp® stimulus. The reference levels of 0 dBnHL were 35.5 dB peSPL for the click stimulus and 31.5 dB peSPL for the LS CE-Chirp® stimulus.
Multiple levels of intensity were presented randomly for both stimuli at 80, 60, 40, and 20 dBnHL. The masking noise of 40 dBnHL was presented on the left ear to prevent the anticipation of the non-test ear cochlea when presenting the stimulus at 80 dBnHL. The participants were instructed to lie down and remain relaxed to minimize the noise and muscle artifacts throughout the test. In each session, the recording was done twice to ensure repeatability and to measure the reliability within the same clinical session (later described as Trial 1 and 2). The same ABR procedure was applied in the second clinical session, and the interval between sessions varied between 7 and 13 days.
The ABRs were averaged using Bayesian-weighted averaging until the residual noise level reached 40 nanovolt, and the maximum averages were set at 12,000 [24]. All of the participants reached the residual noise of 40 nanovolt before the maximum average of 12,000. Therefore, the actual number of sweeps for each of the recordings varied depending on the noise and test environment conditions. The noise rejection level was set to 40 µV. To determine the quality of the ABR, the SNR of each of the ABRs was measured. ABR was considered as present if the SNR was more than three.
Waveform analysis
The variables for this study were the amplitudes and absolute latencies of Waves I, III, and V. Only the amplitude and latency of Wave V was measured at 60, 40, and 20 dBnHL. This is because the ABR of Waves I and III begin to disappear, especially at lower intensity levels [25]. Waves I, III, and V latencies were determined from the onset of the stimulus to the maximum peak of the respective ABR waves. The amplitude of Waves I, III, and V were measured from the waves’ peak to its following trough in microvolts (µV). The same waveform analysis procedure was used for the second session for all the waves tested. The ABR waveform analysis was decided by the first (F.N.J.) and fourth authors (M.N.M.) and confirmed by the second author (A.A.A.D.), who has 17 years of experience in recording ABR. The recording parameters and test conditions of the waveforms were unknown to all of the examiners. Data from both the male and female subjects were pooled since no significant difference was found between the mean of these groups in terms of the amplitudes and latencies of Waves I, III, and V (p>0.05).
Statistical analysis
Parametric tests were used since the data met the parametric assumptions based on the visual inspection of a histogram and box plot and the Shapiro Wilk test (p>0.05). To test the reliability of the ABR to the LS CE-Chirp® stimulus and click stimuli for within and between clinical sessions, the intra-class correlation (ICC) test was computed at a 95% confidence interval. The ICC was used as it considers the variability in results with multiple parameters [26]. The ICC was used to examine the reliability of the absolute latencies, and the amplitude of the ABR (Waves I, III and V) elicited from both the click and LS CE-Chirp® stimuli within the session (repeated ABR on the same clinical session) and between the first session and the second recording session. Poor, moderate, good, and excellent reliability were indicated by ICC values that were less than 0.5, between 0.5 and 0.75, between 0.75 and 0.9, and more than 0.90, respectively [26].
To acquire value differences that can be used to determine a normal variation of the ABR to both the LS CE-Chirp® and click stimuli, the test-retest difference test was computed. To compute the test-retest difference, the ABR absolute latencies and amplitudes were subtracted from the first session and the second session. Note that the test-retest differences are always expressed as positive values. Lastly, a paired sample t-test with a 95% confidence interval was used to compare the mean test-retest difference between the ABR results (amplitudes and latencies) to both the click and LS CE-Chirp® stimuli.
Results
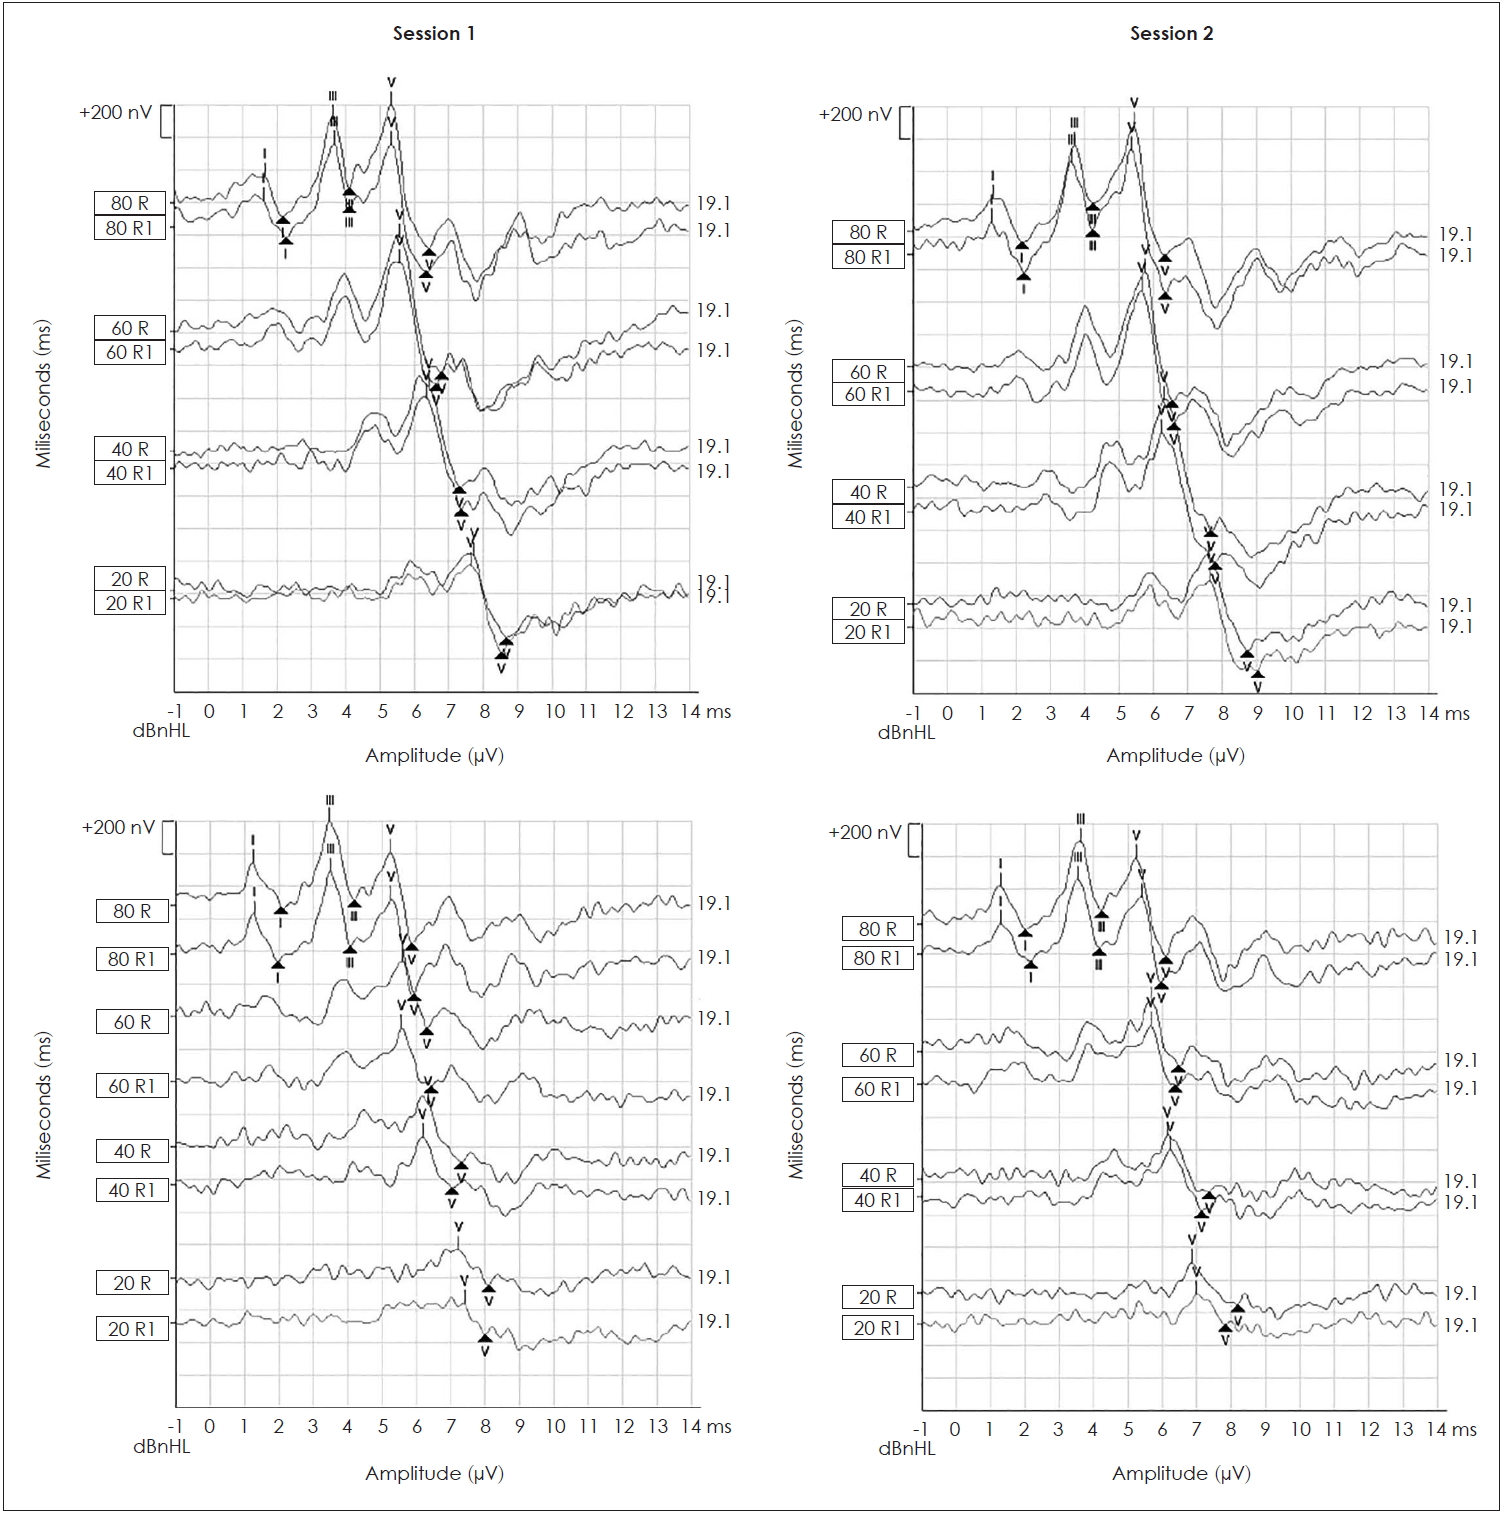
All of the ABR study participants were present at all intensity levels in both clinical sessions. Waves I, III, and V were identified in all study participants at 80 dBnHL in ABR to the click and LS CE-Chirp® stimuli in the first and second sessions. Wave V was identified in all study participants at 60, 40, and 20 dBnHL in the first and second sessions. Fig. 1 illustrates the ABR waveforms recorded from the click and LS CE-Chirp® stimuli in both clinical sessions from one of the study participants.
ICC for absolute latencies of waves I, III and V
Table 1 displays the results from the ICC analysis that was used to evaluate the relationship between the absolute latencies for Waves I, III, and V within the same session (Trial 1 vs. Trial 2) and between different sessions for both the ABR to the click and LS CE-Chirp® stimuli at multiple intensity levels. The analysis shows a significant correlation of the absolute latencies of Waves I and III at 80 dBnHL, and Wave V at all intensities within the same session and between different sessions (p<0.05) for both the ABR to the LS CE-Chirp® and click stimuli. The ICC values for both the ABR to the LS CE-Chirp® and click stimuli were excellent in the within-session analysis and moderate to excellent in the analysis of the different sessions.
ICC for the amplitudes of waves I, III and V
Table 2 displays the results from the ICC analysis that was used to evaluate the relationship between Waves I, III, and V amplitudes in different sessions and within the same session (Trial 1 vs. Trial 2) for both the ABR to the click and LS CE-Chirp® stimuli at multiple intensity levels. The analysis shows a significant correlation of the amplitudes of Waves I and III at 80 dBnHL and Wave V at all intensities within the same session and between different sessions (p<0.05) for both the ABR to the LS CE-Chirp® and click stimuli. For within the same session, the ICC values for both the ABR to the LS CE-Chirp® and click stimuli were excellent except for the ABR to the click stimuli at 20 dBnHL with moderate reliability values. For between different sessions, the ICC values for both the ABR to the LS CE-Chirp® and click stimuli ranged from moderate to excellent reliability with the lowest ICC values obtained from ABR Wave V amplitude to the LS CE-Chirp® at 80 dBnHL.
Test-retest difference
Table 3 and 4 present the values for the test-retest difference of the ABR absolute latencies and wave amplitudes for both ABR to the click and LS CE-Chirp® stimuli between the first and second sessions (mean, standard deviation, 5% percentile, 50% percentile, and 75% percentile). Table 3 and 4 also display the mean and standard deviations of the ABR absolute latencies and wave amplitudes for both stimuli in both sessions.
Based on the results in Table 3, the mean test-retest differences for the ABR waves absolute latencies (I, III, and V) are between 0.02 ms and 0.06 ms for the ABR to the click stimulus and between 0.00 ms to 0.11 ms for the ABR to the LS CE-Chirp® stimulus. Wave V ABR absolute latencies at 40 and 80 dBnHL for the ABR to the click and LS CE-Chirp® stimuli, respectively, give the highest mean test-retest differences.
For ABR wave amplitudes (I, III, and V), the mean test-retest differences were between 0.00 µV and 0.03 µV for the ABR to the click stimulus and between 0.00 µV and 0.02 µV for the ABR to the LS CE-Chirp® stimulus. The highest mean test-retest differences were obtained from Wave V ABR amplitudes at 60 and 80 dBnHL for the ABR to the click and LS CE-Chirp® stimuli, respectively. These results are summarized in Table 4.
Further analysis was done to compare the mean test-retest difference between the ABR to the click and LS CE-Chirp® stimuli. There were no significant differences in the mean test-retest differences between the ABR to the click and LS CE-Chirp® stimuli in all of the test results, including all amplitudes and absolute latencies (p-value>0.05).
Discussion
The present study investigates the test-retest reliability of the ABR to the LS CE-Chirp® and click stimuli in normal-hearing adults at multiple intensity levels. The results showed that the ABR elicited from both the click and LS CE-Chirp® stimuli can be consistently recorded in normal-hearing adults within the same session and in separate clinical sessions. In particular, the ABR absolute latencies and amplitudes (Waves I, III, and V) show high reliability with moderate to excellent ICC values.
The test-retest reliability findings for the absolute wave latencies (I, III, and V) in both the ABR to the click and LS CE-Chirp® stimuli are consistent with the previous literature from the ABR to the click stimulus [17-19,23] and the ABR to the CE-Chirp® stimulus [20]. The present study further suggests the ABR absolute latencies elicited from the LS CE-Chirp® are as consistent and reliable as the ABR to the click stimulus and the previous version of CE-Chirp. This strongly supports the use of this stimulus in clinical settings and for neurological diagnoses [14].
The reliability analysis of the wave (I, III, V) amplitudes in the ABR to the click and LS CE-Chirp® stimuli in the present study is somewhat consistent with previous studies [17,20,27-29]. While the consistency of the waves’ amplitude at multiple intensity levels within the same session and between sessions agrees with the literature, the higher ICC values (moderate-excellent) are contradictory to past findings. Dzulkarnain, et al. [17] in their study found higher variations in the ABR wave amplitudes as compared to the ABR latencies and higher variations in the ABR of later waves as compared to the early waves. The signal averaging strategies used is one of the possible reasons for these differences. In the present study, the ABR signal averaging procedure was only stopped when recording reached a specified residual noise level of 40 nanovolt instead of at a constant number of sweeps (2,000-4,000) as used in the previous literature. ABR amplitudes can easily be affected by noise, especially if there is a large amount of background noise [30]. To overcome this problem, signal averaging is used to improve the ratio of the ABR signal over the background noise. The SNR is inversely proportional to the noise amplitude, i.e., the lower the noise amplitude, the better the SNR. In past studies, the use of constant sweeps (2,000 to 4,000 sweeps) for signal averaging might have resulted in uncertainty regarding the quality of the ABR recordings. If the amount of noise is high, the test-retest reliability analysis could be influenced by the quality of the recording instead of the inconsistency of the ABR amplitudes. Therefore, the use of different signal averaging procedures may explain the differences seen in the present study’s findings and the literature. The results from the reliability analysis suggest that the ABR amplitudes have the potential to be used when recording the ABR to the LS CE-Chirp® stimulus (similar to the ABR to the click stimulus) for both neurological lesion diagnosis and threshold seeking. The optimum SNR of the ABR recording, including the amount of residual noise, should be considered before applying ABR amplitudes clinically.
The acceptable value of the test-retest difference between and within sessions in the ABR to the click and LS CE-Chirp® stimuli were obtained. This value can be used when re-testing the same patient over a period of time. For example, if the ABR amplitudes and absolute latencies change within the cut-off value, those changes can be considered as a normal variation in the ABR recording itself and not because of any physiological changes that occur in the auditory system due to pathological conditions. The mean test-retest differences for the absolute latencies were less than 0.06 ms for the click stimulus and 0.11 ms for the LS CE-Chirp® stimulus. For the ABR amplitudes, the mean differences were less than 0.03 µV for the click stimulus and 0.02 µV for the LS CE-Chirp® stimulus.
In conclusion, this study suggests that the ABR elicited from the LS CE-Chirp® stimulus is as reliable as the standard ABR elicited from the click stimulus based on the number of waves it produced, and the consistent absolute latencies and amplitude values. Future research should explore the test-retest reliability using ABR to the LS CE-Chirp® stimulus in hearing-impaired subjects or those with other pathologies across various age groups and with a larger sample size. This is to determine whether the value difference and reliability are still applicable and can be widely applied to other population groups. Currently, the findings of this study are limited to adult subjects with normal hearing that are aged 18 to 25 years and limited to the equipment, stimulus, and recording parameters used in the present study.