


Introduction
Encoding of complex signals such as music and speech at the brainstem level are affected by listener’s experience, perceptual ability and linguistic experience. In order to study this mechanism, the frequency following response (FFR) provides a reliable and objective method by preserving the spectral and temporal aspects of the original stimulus such as the fundamental frequency (F0). Therefore, comparison of the frequency components of the stimulus to that of FFR is possible [1]. FFR’s have been recorded in literature using pure tones and masked tones [2], English and Mandarin speech syllables [3], words [4], musical notes [5], and emotionally valent vocal sounds [6].
Studies have shown that native mandarin speakers have better representation of F0 [7] probably as a result of them requiring to use F0 contour for lexical representation in everyday situations. Likewise, musicians also show better representation of F0 for speech sounds [8], non native linguistic F0 contours [9] and emotionally salient vocal sounds [6] when compared with non-musicians.
Majority of research carried out on FFR using music stimuli are being restricted to the western musical instruments such as cello notes. Further, synthesized stimuli have been used more commonly. There is paucity of research using Indian classical music stimuli (vocal and instrumental).
Indian classical music can be categorized into the Carnatic and the Hindustani styles. While the former is practiced in the southern part of India, its counterpart is practiced in the northern regions of India. Shruthi, Swara, Raga, and Tala are its basic elements and form the means for improvisation and composition. The performance consists of a small ensemble of musicians, consisting of a vocalist, a melodic accompaniment (probably a violin), a rhythm accompaniment (probably an mridangam), and a tambura, which acts as a drone throughout the performance. Carnatic music is rhythm based and places emphasis on the vocal renditions.
Musicians can be grouped into vocal and instrumental category based on their mode of rendition. Vocalists rely on their laryngeal capabilities to produce different pitches while a violinist perceives and produce non verbal sounds using instruments such as violin, veena, guitar etc. This also implies differences in their training skill sets and mastery levels.
Aim of the study
The study aimed to investigate brainstem encoding of pitch using FFR’s among vocalists, violinists, and non-musicians to Indian Carnatic vocal and instrumental transition musicstimuli and compare the results. It also investigates if musician’s listening biographies would affect their F0 perception at the brainstem level.
Subjects and Methods
Selection of participants
A total of 55 participants in the age range of 18-45 years were considered for the purpose of the study. Purposive sampling was used to select the participants. The participants were divided into three groups. First group of participants consisted of 20 professionally trained Carnatic vocalists [mean=24.65, standard deviation (SD)=5.82] (M:F ratio of 1:4); second group consisted of 13 professionally trained Carnatic violinists (mean=22.31, SD=5.28) (M:F ratio of 1:3.3) while the third group consisted of 22 non-musicians (mean=27.90, SD=4.76) (M:F ratio of 1:1.7). All musicians had minimum experience of 5 years and above in Carnatic vocal and violin music. The musicians practiced for 2-4 hours per day. The non-musicians had no prior training in Carnatic vocal/instrumental music. All participants had bilateral normal hearing sensitivity (pure tone air and bone conduction thresholds within 20 dB HL at octave frequencies from 250 Hz to 8 kHz and 250 Hz to 4 kHz respectively) and no history of otological, neurological problems or noise exposure. All participants had speech identification scores of 90% and above. Bilateral ‘Á’ type tympanogram withipsilateral and contralateral presence of acoustic reflexes were the participants. Informed written consent was taken from all participants prior to conducting the study. An informal questionnaire was used to document the lifestyle and music habits of the participants.
Ethics committee approval
Ethical clearance was taken from the ethics committee of All India Institute of Speech and Hearing, Mysuru.
Methods
The study was carried out in two phases. Phase I was related to Carnatic music stimulus preparation while Phase II involved FFR recording to the Carnatic music stimuli.
Phase I
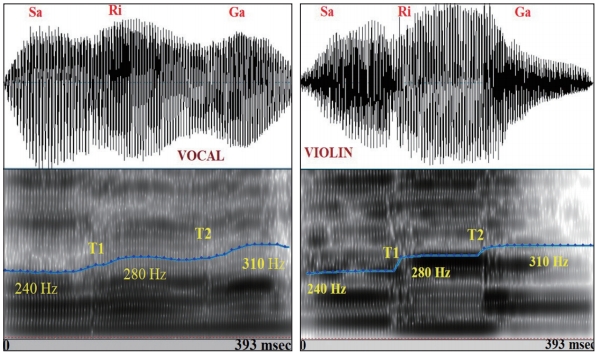
The Carnatic vocal and instrumental stimuli were the same as used in our earlier study [10]. The pitch contour of vocal transition T1 (/S-R2/) varied from 243-278 Hz while that of the instrumental transition T1 was from 242-282 Hz. Vocal transition T2 (/R2-G3/) showed a pitch contour of 273-307 Hz while the instrumental T2 transition had a pitch contour from 285-310 Hz. Fig. 1 represents the stimulus waveform and spectrogram of the Indian Carnatic three note vocal and violin raga stimuli along with the two transitions that were analyzed for the study purpose.
Phase II. Recording of FFR to music stimuli
All participants were educated about the test procedure. They were instructed to sit on a reclining chair and minimize their body and head movements as much aspossible. They watched a muted video with subtitles. The FFR was recorded using neuroscan equipment (Compumedics, Charlotte, NC, USA). The responses were recorded to the Carnatic vocal and violin stimulus for an 80 dB SPL sound presented binaurally using electrically shielded insert earphones to electrodes placed on nape of neck (C7, inverting), Cz (vertex, non inverting), and low forehead (ground). The electrode impedances were less than 5 k ohms for all participants. The participants heard a total of 2,000 sweeps in alternating polarity. The stimuli were presented through the sound module of Stim 2 (Compumedics). The interstimulus duration (calculated from offset to onset) was 135 msec. The order of stimulus presentation was counterbalanced. Further, tube press test was carried out to rule out stimulus artifacts. Continuous electrophysiological data were collected at a sampling rate of 20,000 Hz using a Synamps system. The collected FFR data was subjected to offline processing consisting of artifact rejection (±35 μV), filtering (80-1,800 Hz), epoching (-50 to 450 msec) and averaging using Curry 7.
Data analysis
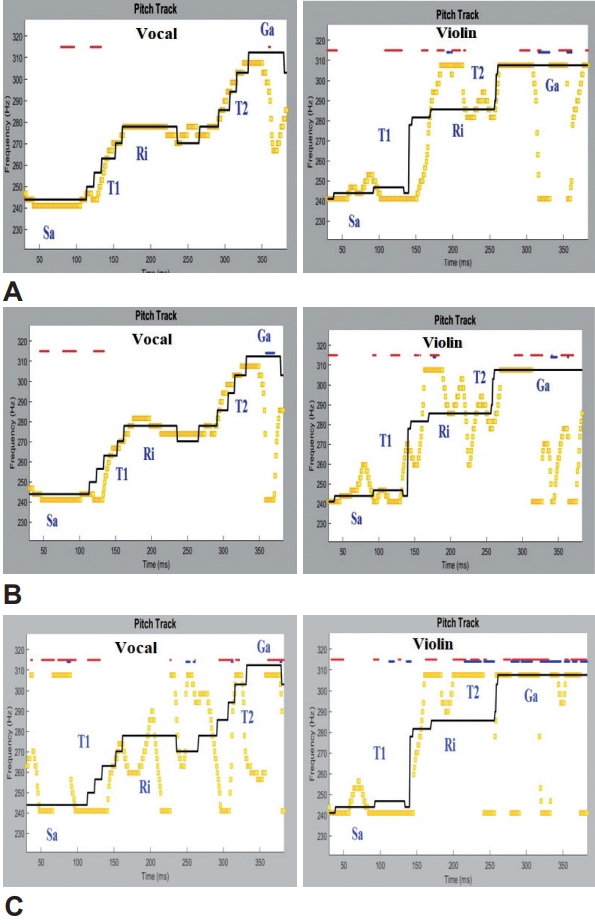
The data was analyzed using Brainstem toolbox, Version 2013 in MatlabTM (Version 7.3). To assess the participants pitch tracking to the Carnatic vocal and violin music stimuli, three parameters were considered; stimulus to response correlation (CC), pitch strength (PS), and pitch error (PE). CC measures the extent of similarity between stimulus and response F0 contours using Pearson’s ‘r’value. The analysis uses a short-time running autocorrelation technique in which the response chopped into 40-ms chunks, is successively time-shifted with a delayed (“lagged”) version of itself (in 1 ms steps) and a Pearson’s r is calculated at each 1-ms interval. PS refers to the strength of relationship. PE measures the deviation of response in Hz from stimulus pitch on an average. Fig. 2 represents the pitch track contours extracted from grand averaged FFR waveforms for the three groups (vocalists, violinists and non-musicians) for vocal and violin stimuli.
Statistical analysis
Data was tabulated and analyzed using the Statistical Package for the Social Sciences version 20 (IBM Corp., Armonk, NY, USA). Descriptive statistics including mean, SD, median and inter quartile range were calculated for vocal and instrumental musicians & non-musicians for the Indian Carnatic vocal and instrumental transition stimuli for three parameters; PE, PS, and CC.
Results
The results will be discussed in the following sections
Comparison of the parameter of PS for the two transitions (T1=/S-R2/, T2=/R2-G3/) between vocalists, violinists and non-musicians for Indian Carnatic vocal stimuli
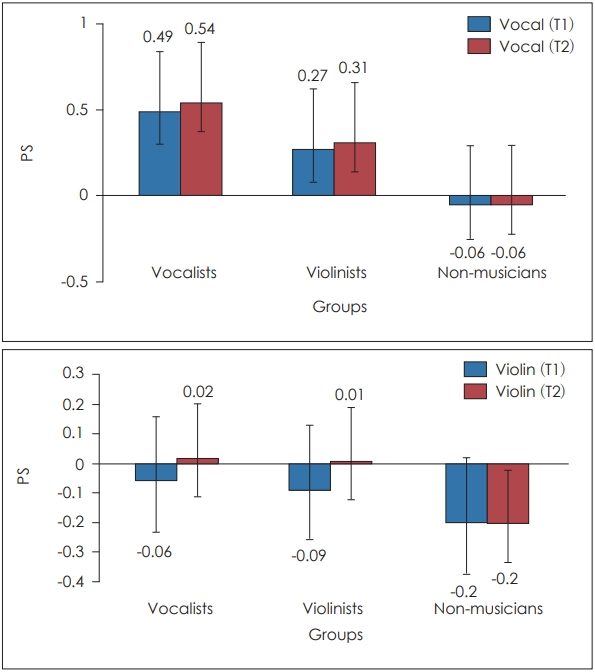
Shapiro-Wilks test of normality revealed a normal distribution for the parameter of PSVT1, PSIT1, PSVT2, and PSIT2. Two way repeated measures ANOVA was carried out with group as between subject factor (vocalists, violinists, and non-musicians) and stimulus type (vocal vs. violin) and transition (T1=/S-R2/ and T2=/R2-G3/) as within subject factors. The main effect of stimulus type [F(1,52)=121.37, p<0.01, η2=0.70] and group [F(1,52)= 55.86, p<0.01, η2=0.68] was significant. The mean scores for the parameter of PS were greater for the vocal stimulus compared to the violin stimulus for both T1 and T2. With respect to groups, vocalists had the highest mean scores for both T1 and T2 followed by the violinists and non-musicians. However, for transitions (T1 and T2) the main effect was not significant. However, the mean scores were comparatively higher for T2 transition compared to T1. Further interaction effect showed a significant difference between stimulus type and group [F(1,52)=15.88, p<0.01, η2=0.38] (Fig. 3). All the three groups performed better for vocal stimulus compared to violin for both T1 and T2. However, no interaction effect was noticed for transition and group, type and transition and type, transition and group.
Comparison of the parameter of PE for the two transitions (T1=/S-R2/, T2=/R2-G3/) between vocalists, violinists, and non-musicians for Indian Carnatic vocal stimuli
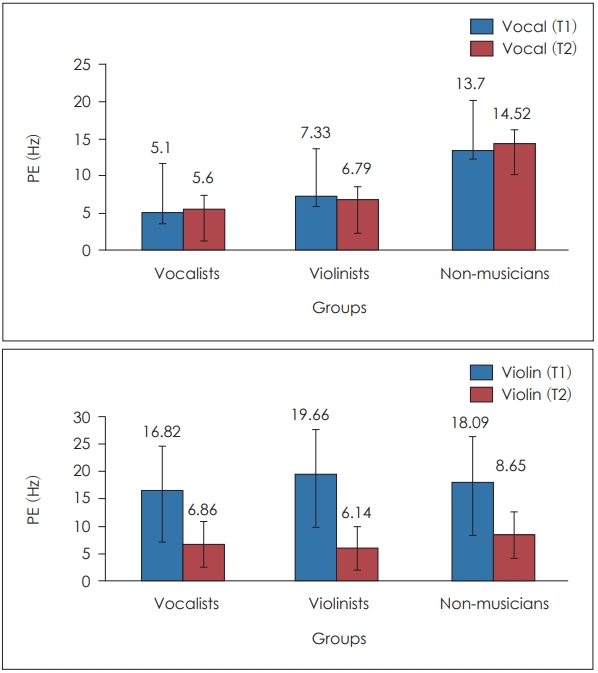
Vocal musicians had the lowest mean error values followed by the instrumental musicians and non-musicians for both vocal and violin T1 and T2 transition (Fig. 4). Shapiro-Wilks test of normality revealed a non normal distribution for the parameter of PEVT1, PEIT1, PEVT2, and PEIT2. Hence, non parametric Kruskal-Wallis test was applied to check if there is any significant difference between the three groups (i.e., vocalists, violinists, and non-musicians) for the two transitions. The test results revealed that there was a significant difference between the three groups for both vocal T1 (χ2=25.60, p<0.01, η2=0.45) and T2 (χ2=26.56, p<0.01, η2=0.47) transition stimuli. T1 transitions had lower mean error values for vocalists compared to T2 transition for vocal stimulus, while the opposite was noticed with the violinists who showed lower error values with T2 transition. However, no significant difference was observed between the groups for violin T1 (χ2=0.40, p>0.05, η2=0.03) and T2 (χ2=3.12, p> 0.05, η2=0.02) stimulus although the mean error values were higher for T1 transition for both vocalists and violinists. Post hoc Mann Whitney U test revealed a significant difference between vocalists and non-musicians and violinists and non-musicians for both T1 and T2 vocal transition stimuli. Both vocalists and violinists showed lower error values over non-musicians. No significant difference between the vocalists and violinists groups was observed for both T1 and T2 vocal transitions. In order to evaluate the performance within each group for vocal vs. violin stimuli, the non parametric, Wilcoxon Signed Rank test was used. All the three groups showed preference for vocal stimulus with lower mean PE score compared to violin stimulus for both T1 and T2 transitions.
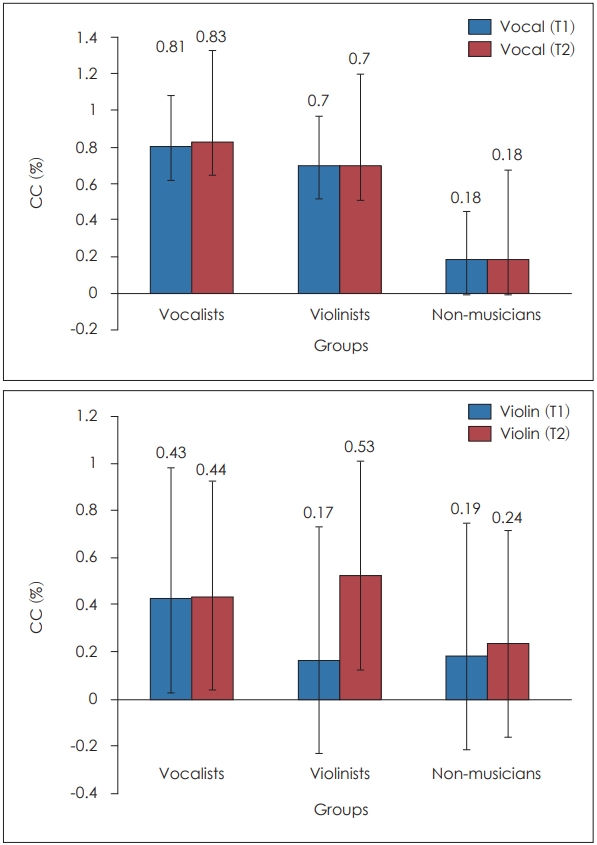
Comparison of the parameter of CC for the two transitions (T1=/S-R2/, T2=/R2-G3/) between vocalists, violinists, and non-musicians for Indian Carnatic vocal stimuli
Vocalists had the highest correlation values followed by the violinists and non-musicians for both vocal and violin T1 and T2 transition (Fig. 5). Shapiro-Wilks test of normality revealed a non normal distribution for the parameter of CCVT1, CCIT1, CCVT2, and CCIT2. Hence, non parametric Kruskal-Wallis test was applied to check if there is any significant difference between the three groups (i.e., vocalists, violinists, and non-musicians) for the two transitions. The test results revealed that there was a significant difference between the three groups for both vocal T1 (χ2=24.65, p<0.01) and T2 (χ2=20.24, p<0.01) transition stimuli. However, no significant difference was observed between the groups for violin T1 (χ2=3.25, p>0.05) and T2 (χ2=3.76, p>0.05) stimulus. Post hoc Mann Whitney U test revealed a significant difference between vocalists and non-musicians and violinists and non-musicians for both vocal and violin stimuli. No significant difference was noticed for vocalists and violinists for both vocal and violin T1 and T2 stimuli. In order to evaluate the performance within each group for vocal vs. violin stimuli, the non parametric, Wilcoxon Signed Rank test was used. All the three groups showed no significant difference between the two vocal transitions.
Discussion
Comparison of the parameter of PS for the two transitions (T1=/S-R2/, T2=/R2-G3/) between vocalists, violinists, and non-musicians for Indian Carnatic vocal stimuli
Vocalists and violinists exhibited superior PS values as compared to non-musicians for both vocal and violin T1 and T2 transitions. Transitions are areas where complex spectro temporal changes occur. The spectral changes in pitch in the transition areas could be very small to be detected by the untrained ears of the non-musicians. Thus, their performance could be poorer compared to the vocalists and violinists who are trained to detect minute variations in pitch. Further, psychoacoustic studies have demonstrated that musicians who tune their own instrument have better frequency discrimination than those who do not [11].
When the two musician groups were compared, vocalists out performed the violinists for the PS parameter for both T1 and T2 vocal stimulus. This could be attributed to their rigorousauditory based learning where they listen to sequence of notes rendered by the teacher and imitate till perfection is obtained. Accurate pitch perception for all the notes in a Raga is essential and so is the improvising to suit the musical emotion/tone and rhythm/pace. Therefore, it can be theorized that vocalists demonstrated better pitch coding abilities not only at the cortical level but at the brainstem level too. Further, as their practice is restricted to vocal training, it could explain their superior performance to vocal stimuli compared to instrumental stimuli. This shows that listening biographies definitely play a significant role in pitch coding at least for the vocalists. Our findings are in agreement with Nikjeh, et al. [12] who used DLFs and reported slightly better pitch production in vocal musicians than instrumental musicians (brass, wind, or strings).
Violinists also performed better to vocal stimulus when compared to instrumental (Figs. 3-5). This aspect of the results was unexpected. This indicates that along with training or practice, physical aspects of stimuli by itself may also influence the results. For the purpose of the study, natural stimulus was recorded. Hence, it may be possible that violin being a string instrument, playing method induced factors like string tension and force applied on the strings could have all introduced some aperiodicity in the complex waveforms. FFR recordings are known to be affected by aperiodicity’s in the stimuli and hence may result in poor PS observed among participant’s recordings for violin stimuli. Such factors which degrade periodicity in vocal stimuli are minimal. Hence, FFR responses among violinists, to vocal stimuli were better as compared to violin stimuli.
Comparison of the parameter of PE for the two transitions (T1=/S-R2/, T2=/R2-G3/) between vocalists, instrumentalists, and non-musicians for Indian Carnatic vocal and violin stimuli
As a result of their training, vocalists and violinists exhibited lower mean error values for both T1 and T2 transitions compared to non-musicians. Their transitions were well delineated in the FFR response waveforms when compared to non-musicians. As the pitch changes in the transition regions were very small, non-musicians were unable to code the transitions. Thus music experience facilitated accurate pitch perception leading to lower error values in instrumentalists. This is supported by studies which have found that instrumental musicians have faster neural responses for pitch changes than non-musicians [13,14]. Within the musician groups, vocalists had lower mean error scores compared to violinists for both vocal and instrumental T1 and T2 stimuli although the difference was not statistically significant. Thus it can be hypothesized that both vocal and instrumental training enhances pitch perception to a similar extent atleast in the transition areas. Another reason may be that in the current study, pitch variations in the transition areas were in the range of 30 Hz which was easier for both the musician groups to perceive and code faithfully. Violinists coded the second transition better compared to first. However, this result was not statistically significant. This may be related to the expectancy effect as once they are able to identify the initial two notes in the raga, then it becomes easier to guess the next note and the transition preceding it as the scale is now fixed and the notes occur at fixed ratios. Further, as the instrumentalists did not show any preference towards the stimulus of their listening biography, it could again be referenced to the nature of the stimulus. It might be prudent to use synthesized stimulus when testing using instrumental stimulus as parameters could be controlled better.
Comparison of the parameter of CC for the two transitions (T1=/S-R2/, T2=/R2-G3/) between vocalists, instrumentalists, and non-musicians for Indian Carnatic vocal and violinstimuli
Vocalists and violinists showed higher CC compared to non-musicians for both vocal and instrumental T1 and T2 transition stimulus. This could be attributed to training induced structural reorganization of the cortex and brainstem following music training. This helps them to perceive and encode the transitions better compared to non-musicians. Within the musician groups, vocalists showed higher mean scores for stimulus response correlation parameter compared to violinists for both vocal and instrumental T1 and T2 transitions. However, significant difference was observed for the vocal stimulus only. This again highlights the exceptional pitch coding abilities in vocalists. The violinist also performed better for vocal stimuli compared to instrumental stimuli. However, mean scores were similar for both the transitions T1 and T2 for both stimuli. Ability to code vocal stimulus better may be related to clear pitch periodicity information available in the vocal stimulus. This information may be obscured by multiple peaks of the partials present in the instrumental stimuli. It could also be hypothesized that smaller spectro temporal changes that the transitions represent may be difficult to play for a short sound duration. Longer signal duration may be able to portray it better.
In conclusion, Carnatic musicians (vocal and violinists) have superior pitch tracking abilities to both vocal and instrumental transition musical stimuli as compared to non-musicians. The results indicate that experience dependent plasticity can be demonstrated at the brainstem level itself. This holds true for both vocal and violin music, a finding not reported previously. Vocalists performed superiorly compared to violinists for both stimulus types. Thus the link between music training received and FFR response maybe strongly demonstrated for vocalists than for violinists.