


Introduction
Participation in the workforce is one of the significant events of life as defined by the International Classification of Functioning, Disability, and Health (ICF) of the World Health Organization [1]. Nevertheless, there are some difficulties that make impossible for people with ŌĆ£handicapsŌĆØ to participate at work, which have been identified in the earlier version of the ICF. Although people with hearing impairment have recently gained several opportunities for employment with the improvement of welfare worldwide, hearing impairment seemed to influence their employment status [2]. For example, persons with communication disabilities experienced difficulties in coping at work for various reasons [3] and difficulties in maintaining a stable job [4]. In fact, the number of economically non-active individuals in the hearing and/or speech impaired population in Korea was 185,840 (65.0%) out of 285,996, indicating a higher rate of nonparticipation than those observed among people with physical disability, mental retardation, and visual impairment in 2017 [5]. This high nonparticipation rate in comparison to other countries such as the United States and the United Kingdom might cause societal problems domestically [6,7].
Although most functions other than communication skills are normal, it has been reported that workers with hearing impairment have difficulty maintaining a job for a long time [8,9]. The difficulties in communication and building personal relationships and differences in aptitude were reported to be the reasons [10]. The top 10 soft skills required at the workplace were integrity, communication, courtesy, responsibility, social skills, positive attitude, professionalism, flexibility, teamwork, and work ethic [11]. Among those, communication, social skills, teamwork, and flexibility were highly related to hearing sensitivity. Therefore, hearing ability was pointed to be essential in the modern workplace due to the greater demand for interpersonal qualities. Moreover, the hearing-impaired workers could be overlooked their work disparity because of the hidden nature of hearing loss [12].
Individuals with hearing impairment exhibited various differences in the working environment in comparison with normal-hearing workers, including work ability, style of job management, and mental stress management [13]. High stress at work was reported to originate from the imbalance between elevated job demands and low job control, which was common among 445 hearing-impaired workers in Sweden in one study [14]. Surprisingly, hearing-impaired workers were more sensitive to background noise than normal-hearing workers since their self-perceived rating for noise in the working environment appeared to be higher [15]. A noisy working environment could adversely influence listening ability in working conditions and induce more fatigue and stress, resulting in negative occupational performance [16]. Thus, workers with hearing loss might experience greater strain while participating in conversations and endure poor working environments.
Fortunately, the Amsterdam checklist for hearing and work was developed by researchers in the Netherlands to identify occupational difficulties in relation to hearing loss [10]. With this checklist, the researchers compared the occupational performance of employees with and without hearing loss to 150 hearing-impaired employees and 60 normal-hearing work colleagues. They found the workplace difficulties related to hearing impairments, including environmental noise level, reverberation, distinction of sounds, job demand, job control, and effort in hearing and discussed the importance of hearing functions and the implications for rehabilitation. Consequently, vocational enablement protocol, which was characterized as an integrated approach, was developed including hearing aid refitting, communication training, environmental modification including changes in furniture and lighting, allotment of separated work rooms, psychological counseling, the use of assistive listening devices, re-delegation of assignments, management of time schedules, and occupational retraining [17].
The Amsterdam checklist for hearing and work was used in two investigations on Icelandic and Norwegian workers. B├Č├░varsd├│ttir [18] assessed 46 workers with two questionnaires, the Amsterdam checklist for hearing and work and the Icelandic version of the General Nordic questionnaire for psychological and social factors at work, and found that both deaf individuals and those who were hard of hearing required social support. The researcher noted that the importance of developing a standardized assessment tool measuring psychological distress in workers with and without hearing difficulties. Investigating 3,330 Norwegian hearing-impaired workers using the Amsterdam checklist for hearing and work, hearing loss was found to impact work participation factors negatively. The authors concluded that greater attentiveness to hearing-impaired workers would reduce their experience of the disability [19].
However, no corresponding investigations have been conducted for hearing-impaired workers in Korea. Therefore, the Amsterdam checklist for hearing and work was translated into Korean with the consent of the authors through e-mail and verbal agreements and was applied for the assessment of Korean hearing-impaired workers (Supplementary Material in the online-only Data Supplement). The aim of this study was to compare the occupational performance of workers with hearing loss to that of their normal-hearing work colleagues. Also, comparing the difference hearing-related difficulties in the working environment experienced between the Netherlands and Korean hearing-impaired workers, the specific difficulties could be defined for the Korean workers. Identification of the specific difficulties at work and application of appropriate rehabilitation programs which has been shown to improve the welfare of hearing-impaired workers by making their working conditions more adaptive could be developed for Korean workers. The findings would increase the employment rate and the improvement of welfare of hearing-impaired workers would be possible in the future with suitable social support and effective communication for Korean hearing-impaired workers.
Subjects and Methods
Subjects
All participants were recruited from two institutes, ŌĆ£Vocational Training Center for the Hearing ImpairedŌĆØ of the Korean Employment Agency for the Disabled and ŌĆ£Chungeum Rehabilitation Center,ŌĆØ which concentrated on employment of hearing-impaired individuals. Normal-hearing colleagues who performed essentially the same job at the same workplace as the hearing-impaired workers were invited to volunteer. They were all office worker and worked at the general environment of office. A total of 129 individuals (68 female, 61 male), including 86 hearing-impaired workers (38 female, 48 male) and 43 normal-hearing colleagues (30 female, 13 male), who were at the state of employment when they responded participated. The mean age of the study population was 34.04 years [17-58 years, standard deviation (SD): 11.04]; the mean age of the normal-hearing workers was 37.86 years (23-63 years, SD: 11.03), and the mean age of the hearing-impaired workers was 32.13 years (17-58 years, SD: 11.63). The current study applied the grading system of hearing disability in the Standards for Judgement of the Disability Grade (2018 year version). Among the hearing-impaired workers who participated in the current study, 78 were categorized as grade 2 that indicated pure tone average hearing thresholds above 90 dB HL in both ears, 7 as grade 3 that indicated pure tone average hearing thresholds at 80-89 dB HL in both ears, and 1 as grade 4 that indicated pure tone average hearing thresholds at 70-79 dB HL in both ears. When the educational levels (elementary, middle, high, undergraduate, and graduate school) were recorded on a scale of 1 to 5, the average educational level was 3.62 (SD: 0.57) for the normal-hearing group and 3.22 (SD: 0.75) for the hearing-impaired group, indicating a lower educational level in the hearing-impaired group.
This study was approved by the Institutional Review Board of Hallym University (HIRB-2016-050).
Instrument
The survey instrument was the Amsterdam checklist for hearing and work that Kramer, et al. [10] developed. We adapted it via translation and back-translation from English to Korean with the authorsŌĆÖ permission. It consisted of 28 items having three sections. Section 1 assesses the characteristics of the occupation and workplace; section 2 evaluates listening efforts in five hearing activitiesŌĆödetection of sounds, speech communication in quiet, speech communication in noise, distinguishing between sounds, and localization of sound; and section 3 assesses the general working conditions, including job demand, job control, career satisfaction, and social support. The participants are required to answer questions of the checklist themselves.
Data analysis
The generalized linear model multivariate analysis was applied to analyze the differences between the normal-hearing and hearing-impaired groups for multiple dependent variables. To analyze the relationship between the variables and hearing impairment, the analysis was done with four working conditions (job demand/job control/social support/career satisfaction); demographic information (age/sex/education level); type of contract (temporary status/permanent status); hearing impairment (yes/no) as independent variables. The Bonferroni approach was used to assess statistical significance by adjusting for multiple comparisons. All variables of the checklist were analyzed using Spearman rank correlation coefficients. Goodman and KruskalŌĆÖs tau was selected to test the association between the hearing-impaired group and the variables of the questions required yes and no answer choosing one out of two item variables such as ŌĆ£sick-leave,ŌĆØ ŌĆ£reason for sick-leave,ŌĆØ and ŌĆ£type of contract.ŌĆØ Statistical analyses were performed using SPSS version 23.0 (IBM Corp., Armonk, NY, USA) with a significance level of 0.05.
Results
Daily activities at workplace and educational levels
When counted the daily activities at the workplace for both groups, ŌĆ£administrativeŌĆØ activity was the most frequent activity for both groups, showing a lower rate for the hearing-impaired workers. Moreover, ŌĆ£telephone conversationŌĆØ for the normal-hearing group and ŌĆ£teachingŌĆØ for the hearing-impaired group were other frequent daily activities. The hearing-impaired and normal-hearing groups respectively included 2.3% and 0% elementary school graduates, 9.3% and 2.3% middle school graduates, 55.8% and 34.9% high school graduates, 39.1% and 60.6% university undergraduates, and 3.5% and 2.3% university postgraduates. The university undergraduate and high school graduate levels demonstrated the largest number of participants in the normal-hearing and hearing-impaired groups respectively.
Differences between normal-hearing and hearing-impaired workers in the Amsterdam checklist for hearing and work
The overall multivariate analysis of variance revealed a significant group effect [F(124, 1)=4.536, p<0.05], indicating that hearing-impaired workers responded differently from their normal-hearing colleagues in several aspects. The means, SD, and levels of significance of the variables were outlined in Table 1. When the type of contract was compared with respect to temporary and permanent statuses, 35% (15 out of 43) of those with normal hearing and 47% (41 out of 86) of those with hearing impairments reported that they had permanent job statuses [F(124, 1)=4.231, p<0.05]. However, when the type of contract was compared between full- and part-time positions, 100% of the participants in both groups reported having full-time jobs. Absences for sickness appeared to be a slightly higher in the normal-hearing group, 42% (18 out of 43), than in the hearing-impaired group, 33% (28 out of 86) [F(124, 1)=4.752, p<0.05]. The reasons for sick-leaves included all reasons other than mental distress in both groups. The mean number of sick-leave days in the past 12 months was greater than one (1.05) in the normal-hearing workers and less than one (0.51) in the hearing-impaired workers, with the difference showing a statistical significance. In the classification of the frequency of hearing activities, ŌĆ£detection of soundsŌĆØ was the only variable that showed a difference between the groups, with the normal-hearing group reporting more instances of detection of background sounds [F(124, 1)=4.939, p<0.05]. Out of the two questions for the classification of the working environment, only ŌĆ£self-perceived reverberationŌĆØ showed a statistical significance, with higher scores in the hearing-impaired workers [F(124, 1)=4.018, p<0.05].
None of the variables in the categories of ŌĆ£effort and concentrationŌĆØ and ŌĆ£general working conditionsŌĆØ demonstrated a statistical significance. Although ŌĆ£hours of work per weekŌĆØ also did not show statistically significance, normal-hearing workers reported that they worked 10.81 hours more than hearing-impaired workers weekly. Notably, the scores for ŌĆ£workdays per weekŌĆØ (5 days in both groups), ŌĆ£self-perceived environmental noise,ŌĆØ ŌĆ£job control,ŌĆØ and ŌĆ£social supportŌĆØ were identical scores in the two groups.
The Spearman rank correlation coefficients of all variables involved in this study are outlined in Table 2. The three highest positive correlations were observed between ŌĆ£social supportŌĆØ and ŌĆ£career satisfactionŌĆØ (r=0.766), ŌĆ£distinguishing soundsŌĆØ and ŌĆ£effort in hearingŌĆØ (r=0.712), and the ŌĆ£localization of soundsŌĆØ and ŌĆ£effort in hearingŌĆØ (r=0.695). The three highest negative correlations were found between ŌĆ£grade of HDŌĆØ and ŌĆ£hours per weekŌĆØ (r=-0.313), ŌĆ£grade of HDŌĆØ and ŌĆ£educationŌĆØ (r=-0.288), and ŌĆ£grade of HDŌĆØ and ŌĆ£ageŌĆØ (r=-0.247). The ŌĆ£sexŌĆØ (r=0.237), ŌĆ£ageŌĆØ (r=0.456), and ŌĆ£educationŌĆØ (r=0.192) showed significant correlations with ŌĆ£hours per weekŌĆØ. The ŌĆ£hours per weekŌĆØ showed a positive correlation with the general working conditions including ŌĆ£job demandŌĆØ (r=0.369), ŌĆ£job controlŌĆØ (r=0.216), ŌĆ£social supportŌĆØ (r=0.184), and ŌĆ£career satisfactionŌĆØ (r=0.304). The variable ŌĆ£effort in hearingŌĆØ was significantly correlated with all the variables in the classification of hearing activity. Two variables from the classification of the working environment, ŌĆ£perceived noiseŌĆØ and ŌĆ£perceived reverberation,ŌĆØ were significantly correlated with all the variables in the classifications of hearing activity and effort in hearing. All variables of the classification of hearing activity were significantly correlated with variables in the classification of general working conditions. ŌĆ£Effort in hearingŌĆØ was significantly correlated with all the variables in the classification of general working conditions.
Comparison of working environment and difficulties between Korean and Dutch hearing-impaired workers
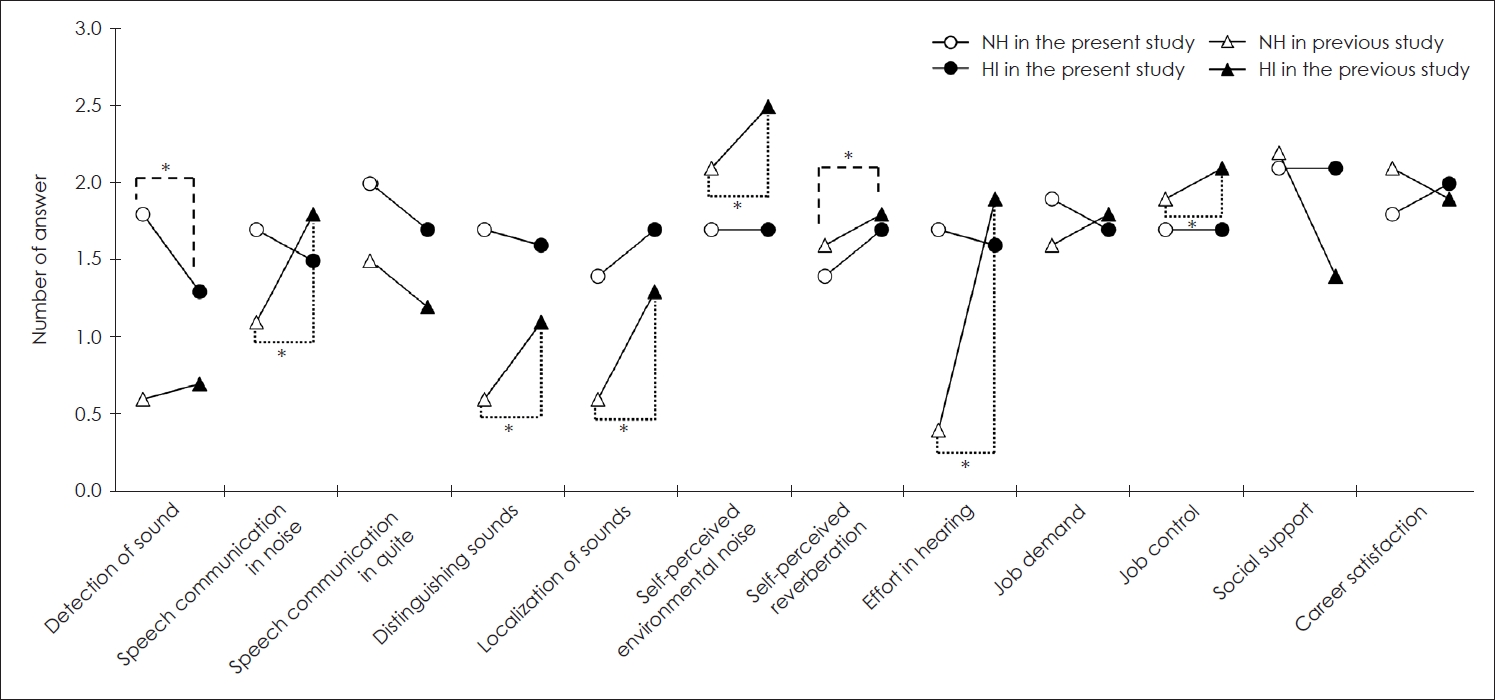
Since this study was conducted using almost the same methods as the earlier study of the Amsterdam checklist for hearing and work [10], it was possible to compare the working environment and difficulties of hearing-impaired workers from Korea and the Netherlands. Surprisingly, the results of the two studies were quite different (Fig. 1). For workers from both countries, the question ŌĆ£speech communication in quietŌĆØ showed lower scores and the questions ŌĆ£localization of soundsŌĆØ and ŌĆ£self-perceived reverberationŌĆØ revealed higher scores in the hearing-impaired group. Six variables, ŌĆ£detection of sounds,ŌĆØ ŌĆ£speech communication in noise,ŌĆØ ŌĆ£distinguishing sounds,ŌĆØ ŌĆ£effort in hearing,ŌĆØ ŌĆ£job demand,ŌĆØ and ŌĆ£career satisfactionŌĆØ demonstrated dissimilar patterns between the two countries. While ŌĆ£self-perceived environmental noiseŌĆØ and ŌĆ£job controlŌĆØ showed identical scores between the normal-hearing and hearing-impaired groups in Korean study, higher scores in the hearing-impaired group was identified in Dutch study. Also, while the scores for ŌĆ£social supportŌĆØ were the same for both normal-hearing and hearing-impaired workers in Korean study, the scores were much lower for hearing-impaired workers in Dutch study. When the variables assessed using 5-point scales in questionnaires were compared between the normal-hearing and hearing-impaired groups, only two variables, ŌĆ£detection of soundsŌĆØ and ŌĆ£self-perceived reverberationŌĆØ showed statistical significance in Korean study, whereas six variables, ŌĆ£speech communication in noise,ŌĆØ ŌĆ£distinguishing sounds,ŌĆØ ŌĆ£localization of sounds,ŌĆØ ŌĆ£self-perceived environmental noise,ŌĆØ ŌĆ£effort in hearing,ŌĆØ and ŌĆ£job controlŌĆØ were significantly different in Dutch study. For ŌĆ£type of contract,ŌĆØ ŌĆ£sick-leave in the past 12 months,ŌĆØ and ŌĆ£reason for sick-leave,ŌĆØ in which participants needed to choose one out of two items, the results were significantly different for two countries. The higher ratios of permanent job contraction and the full-time job for Korean hearing-impaired workers were revealed. Moreover, unlike the findings in the Dutch study, the Korean normal-hearing group did not show a higher rate of sick-leaves in the past 12 months, nor did the Korean hearing-impaired group report a higher proportion of sick-leaves with mental distress as the reason (Fig. 2).
Discussion
When compared with the normal-hearing workers, hearing-impaired workers had 12% more permanent job statuses and 100% full-time jobs and showed 9% lower rates of sick-leaves in Korea. They detected sounds less frequently and perceived reverberation more frequently at the workplace. They felt more satisfied with their career as they got more social support. ŌĆ£Effort in hearingŌĆØ was necessary for better performance in most hearing activities such as detection of sounds, communication in noise, and distinguishing and localizing sounds. The number of hours worked per week increased as age, perceived reverberation, job demand, and job career satisfaction increased. When compared the results of the normal-hearing and hearing-impaired workers between Korea and the Netherlands, the same trends were observed in three variables. The trends of speech communication in quiet showed lower scores but self-perceived reverberation and localizing sounds showed higher scores in the hearing-impaired workers for both countries. Especially, the hearing-impaired workers from both countries reported localization of sounds more frequently than the normal-hearing workers. It was thought that the hearing-impaired workers might have felt more necessarily for localizing sounds due to the hearing loss. However, speech in noise, detecting and distinguishing sounds, perceiving environmental noise, effort in hearing, job demand, job control, social support, and carrier satisfaction variables showed different trends. Out of those variables, effort in hearing and job demand were reported to be slightly higher in Korean normal-hearing workers even though its difference was not significant. This small difference happened possibly due to more workload built to the normal-hearing workers, causing more effort in hearing and job demand appear.
The correlation coefficient results in this study revealed the consistency between variables. A high correlation between ŌĆ£social supportŌĆØ and ŌĆ£career satisfactionŌĆØ implied that workers who received adequate social support from colleagues would achieve career satisfaction. Nevertheless, this form of social support seemed to be more common at higher severities of hearing loss, since a previous study reported that the deaf group received better social support than the hard of hearing group [18]. It is possible that social support was adequately given to people with remarkable impairment, including severe to profound hearing loss. Moreover, the likelihood of workplace accommodation increased with an increasing degree of hearing loss [19]. However, in the present study, 90.6% of hearing-impaired participants were categorized into profound hearing loss, and the hearing-impaired workers received the same level of social support as normal-hearing workers. A good conceptual overview of social support was described in the literature identifying four attributes such as emotional support, instrumental support, informational support, and appraisal [20]. Simply, social support at the workplace could be provided when supervisors could be helpful and colleagues would be friendly. Specifically, a helpful supervisor was described with the characteristics ŌĆ£being concerned,ŌĆØ ŌĆ£good organizing,ŌĆØ and ŌĆ£paying attention.ŌĆØ The primary characteristics of a friendly colleague were ŌĆ£helpful,ŌĆØ ŌĆ£interested,ŌĆØ and ŌĆ£competentŌĆØ [21]. Males, older participants, those with higher education levels, and those with better hearing ability were more likely to work longer. This trend was observed as a similar phenomenon for typical Korean workers [22].
ŌĆ£Effort in hearingŌĆØ was correlated with differentiation and localization of the sounds at the workplace. It appeared to be remarkably associated with all variables in the classification of hearing activity such as detection of sounds, speech communication in quiet, speech communication in noise, and distinguishing and localizing sounds proving that hearing-impaired workers needed to put their effort in hearing almost always. Furthermore, the inability to hear non-verbal contextual sounds would generate psychological distress and loss of control of the situation [23] increasing the degree of effort for hearing at the workplace. This kind of workerŌĆÖs effort in hearing was known to be the cause of a highly stressful life, including stress and fatigue, when it was related to job demand, job control, and occupational risks [14]. Two variables from the categories of working environment, perceived noise and reverberation, were also remarkably associated with ŌĆ£effort in hearing.ŌĆØ In this poor working environment, workers were required to put more ŌĆ£effort in hearingŌĆØ and consequently get more fatigued and mentally distressed, and the findings agreed with the argument that the aspect of effort in hearing deserved more attention [10].
The ŌĆ£perceived level of noiseŌĆØ (r=0.510) and ŌĆ£perceived reverberationŌĆØ (r=0.389) showed notable associations with the frequency of experiencing ŌĆ£communication in noiseŌĆØ at work, showing that workers who communicated frequently in noisy backgrounds perceived more environmental noise and reverberation in their work life. The negatively correlated variables were ŌĆ£type of contractŌĆØ and ŌĆ£communication in quietŌĆØ (r=-0.216) and ŌĆ£hours per weekŌĆØ and ŌĆ£perceived reverberationŌĆØ (r=-0.220). Thus, permanent employees communicated less frequently in quiet environments, and the workers who worked more hours perceived less reverberation. Again, in poor working environments, stronger ŌĆ£effort in hearingŌĆØ was essential, which prompted mental and physical exhaustion among the hearing-impaired workers. As all participants worked in comparable environments, the background noise level and perceived reverberation were expected to be the same for both the normal-hearing and the hearing-impaired workers. However, the hearing-impaired workers perceived more ŌĆ£self-perceived reverberationŌĆØ in this study. The previous studies explained that hearing-impaired workers were more sensitive to the background noise than normal-hearing workers [16] and speech recognition scores of hearing-impaired workers quickly decreased with increasing reverberation [24]. Considering the general agreement among investigators for this factor, many studies attempted to resolve the problems encountered at the workplace for the hearing-impaired by using a rehabilitative process [1,25,26]. Many contents were presented as the results of the studies. For example, environmental modifications for improving acoustical environments including the optimal arrangement of the furniture at the workplace, improvement of room acoustics using carpets and curtains, and the provision of light were suggested.
Most hearing-impaired participants in this study had severe or profound hearing loss for a long duration. Most participants were graduates of high schools with an average age of 32.13 years. The educational level among the hearing-impaired participants was consistent with that in the Netherlands [10]. Hearing impairment with lower education affected both education and employment status [2]. However, in comparison with Norwegian and Icelandic studies, which reported that most hearing-impaired participants were college graduates [18, 19], the educational level was lower in the participants of this study. In fact, most participants in the hearing-impaired and normal-hearing groups were at the high school graduate and university graduate levels, respectively. Moreover, lower education levels were correlated with noisy working environments (r=-0.154), implying that the working environments of employees with lower education levels was noisier. The job quality in such noisier working environments could also be expected to be low. While ŌĆ£job controlŌĆØ and ŌĆ£social supportŌĆØ scored the same in hearing-impaired and normal-hearing workers, the results for the hearing-impaired workers indicated less ŌĆ£job demand,ŌĆØ less ŌĆ£effort in hearing,ŌĆØ and more ŌĆ£career satisfactionŌĆØ in this study.
Korean workers worked more hours and took fewer sick-leave days than those in the Netherlands. When the normal-hearing and hearing-impaired groups were compared, ŌĆ£hours of work per weekŌĆØ were 31.4 and 31.7 for the Netherlands workers without and with hearing loss, respectively, and 42.06 and 31.3 for Korean workers. Similarly, the ŌĆ£number of sick-leave days in the past 12 monthsŌĆØ were 6.01 and 26.31 for the Netherlands workers and 1.05 and 0.51 for Korean workers. This trend was well demonstrated by the high Korean national rates of no sick-leave days, about 87% and 97%, for both normal-hearing and hearing-impaired groups. Also, similar to the result of the present investigation, the average ŌĆ£hours of work per weekŌĆØ was found to be over 40 hours, as the working hours were identified to be less than 40 hours per week for 52%, 41-52 hours per week for 27%, and more than 53 hours per week for 21% of all Korean workers. This phenomenon could be related to the general work attitude and unique cultural values of Korean workers. Korean workers are known to be diligent, loyal, and committed to their employers, and their high performance has been identified as a reason for KoreaŌĆÖs rapid industrialization in cross-cultural studies [27,28]. Thus, Korean workers appeared to exert themselves as much as possible to accept any kind of hearing activity. This might have caused more physical and mental fatigue among the hearing-impaired workers, even though they did not complain about it. Moreover, Korean hearing-impaired workers took significantly fewer sick-leave days for both the normal-hearing and hearing-impaired workers than other countries [10,29]. A deep-rooted philosophy in Korean society, Confucianism, possibly played a role for placing high value on hard work, loyalty, responsibility, dedication to duty, and achievement-oriented education for most workers [27]. Therefore, the working hours should be controlled adequately so that the workers can work more effieciently and prevent stress from working environment. Also, more number of sick-leave days should be provided to the employees and more supportive atmosphere for taking sick-leave should be provided for the hearing-impaired workers.
The present study noted that hearing-impaired workers perceived reverberation more frequently and background noise less frequently. Consequently, ŌĆ£effort in hearingŌĆØ was necessary for most hearing activities for better performance at work. Based on these findings, we can conclude that there is a need for increased awareness of working environment such as reverberation. In terms of noise and reverberation, proper modifications for the working environment like carpets, curtains, copiers, and printers are strongly recommended at the workplace. Social support seems to be an important factor in increasing career satisfaction and the employment rate for hearing-impaired workers. Considering cultural differences, specific questionnaires should be developed for each country. Even though this study investigated the occupational performance of Korean workers with and without hearing loss, the limitation of recruiting participants was existed.