


Introduction
The brain is underdeveloped at birth and cortical development is dependent on extrinsic stimulation. Sufficient auditory input should be provided for appropriate development of the auditory cortex during the sensitive period when neuroplasticity of the auditory cortex is at a maximum [1]. Likewise, deprivation of auditory input during the sensitive period has an adverse effect on maturation of the auditory cortex [2].
Cortical auditory evoked potentials (CAEPs) can be used to assess the maturational status of the auditory cortex [3]. CAEPs include obligatory, passively elicited P1, N1, and P2 components. P1 originates from the primary auditory cortex and thalamus [4] and is present in newborns with normal hearing as robust, positive deflection. The latency of P1 is about 250 ms in very young infants, reducing with maturity to typically 50 ms in adults [5]. P1 is the dominant component of CAEPs during early childhood, but the amplitude of P1 gradually decreases with advancing age. N1 and P2 originate from secondary auditory cortex and higher-level auditory areas [6]. N1 emerges after age 6-7 years as an invagination of the CAEP waveform. N1 is a dominant CAEP component in older children and adults with normal hearing and reflects their higher-order auditory areas. Therefore, the N1 component of CAEPs can be used to examine long-term development of the auditory cortex. The most common components of CAEP in mature adults are a first positive wave, P1, occurring around 50 ms after the stimulus, a first negative wave, N1, around 100 ms, and another positive wave, P2, around 180 ms [7].
A cochlear implant (CI) effectively restores the auditory function of patients with cochlear hearing loss. There have been several studies showing the maturation of CAEPs following CI surgery in deaf children [1,3,6,8]. The studies demonstrated a gradual decrease in the latency of the P1 component with increased duration of hearing experience with the CI [9,10], and showed that children who received a CI before 3.5 years of age had a P1 latency within normal limits for their age [3]. Most published studies of CAEPs in patients with CI included children and focused on the latency of the P1 component; CAEP studies including mature adults who use a CI are rare. As such, this study was performed to examine the maturational status of the auditory cortical areas in adults with a CI by comparing their P1, N1, and P2 latencies with those of participants with normal hearing.
Subjects and Methods
Participants
Fifty subjects including 25 patients with CIs and 25 subjects with normal hearing participated in this study. All the participants were adults (age 18 years or older) except two patients with CI whose ages were 17 years old.
The mean age of 25 patients with CIs was 38.4 years (range 17-79 years). They were divided into three groups depending on the age of onset of deafness. Group A, patients with prelingual deafness who had received CI during early childhood (n=7); group B, patients with early childhood-onset, progressive deafness who received CI during childhood (n=6); and group C, patients with adult-onset deafness (n=12). The median deaf duration, the time interval between onset of deafness and CI surgery were 6.1 years in group A, 2.35 years in group B, and 6.75 years in group C. The median age at CI surgery were 6.1 years in group A, 16.55 years in group B, and 54.45 years in group C. The median age at participating in this study were 18 years in group A, 19 years in group B, 54.65 years in group C. All the patients had normal cochlea and normal cochlear nerve in imaging studies including temporal bone computed tomography and magnetic resonance images of the internal auditory canal. No one had brain parenchymal lesion in the imaging studies.
Twenty-five subjects with normal hearing for both ear were matched for age with the patients with CIs and served as controls. Normal hearing was defined as a pure-tone threshold better than or equal to 25 dB HL for octave frequencies between 250 Hz and 8,000 Hz. More details regarding demographics of the CI patients and the controls are provided in Table 1.
None of the participants had a medical history of psychiatric, cognitive, or language-related diseases.
Methods
CAEPs were recorded from all participants. CI users wear their speech processors during the measurement. CAEPs were recorded in response to a 1,000 Hz tone burst sound. The duration of the sound stimulus was 100 ms (10 ms rise time, 80 ms plateau, and 10 ms fall time). Stimulation intensity was 80 dBnHL and stimulation rate was 0.7/s. We have found this intensity to be effective to elicit clear and robust CAEP [11,12]. The stimulus was presented via a speaker placed 1 m in front of the participants who were seated in a comfortable reclining chair in a sound-treated booth. They watched an animation movie without sound during CAEP measurements.
The electroencephalographic response was collected using Viking IV (Nicolet Biomedical, Fenton, MO, USA). Scalp recordings were made using silver-coated surface-recording electrodes at midline (Fz; upper forehead) referenced to the contralateral mastoid. An electrode positioned at Fpz (lower forehead) was used as a ground. Eye blink was monitored using electrodes located above and below the eye contralateral to the test ear. Responses were amplified with a gain of 10,000 and filtered from 1 Hz (high-pass filter) to 30 Hz (low-pass filter). The recording window included a 50 ms prestimulus period and a 450 ms poststimulus period, and over 200 sweeps were obtained for each stimulus. Two CAEP waveforms for each stimulus were obtained to check reproducibility, and the mean latencies of each component of the CAEP were measured.
The latencies of P1, N1, and P2 components of the CAEP were compared between the patients with CIs and the participants with normal hearing. Analyses were performed using linear regression analysis, an independent t test, Kruskal-Wallis test, or Mann-Whitney U test using SPSS version 21.0 statistical software (IBM Corp., Armonk, NY, USA). p<0.05 was considered significant in tests of statistical inference. This study was approved by the Institutional Review Board of Dong-A University Hospital (DAUHIRB-TEMP-18-242). The written informed consent was obtained from all patients.
Results
Incidence of P1, N1, and P2 of the CAEP
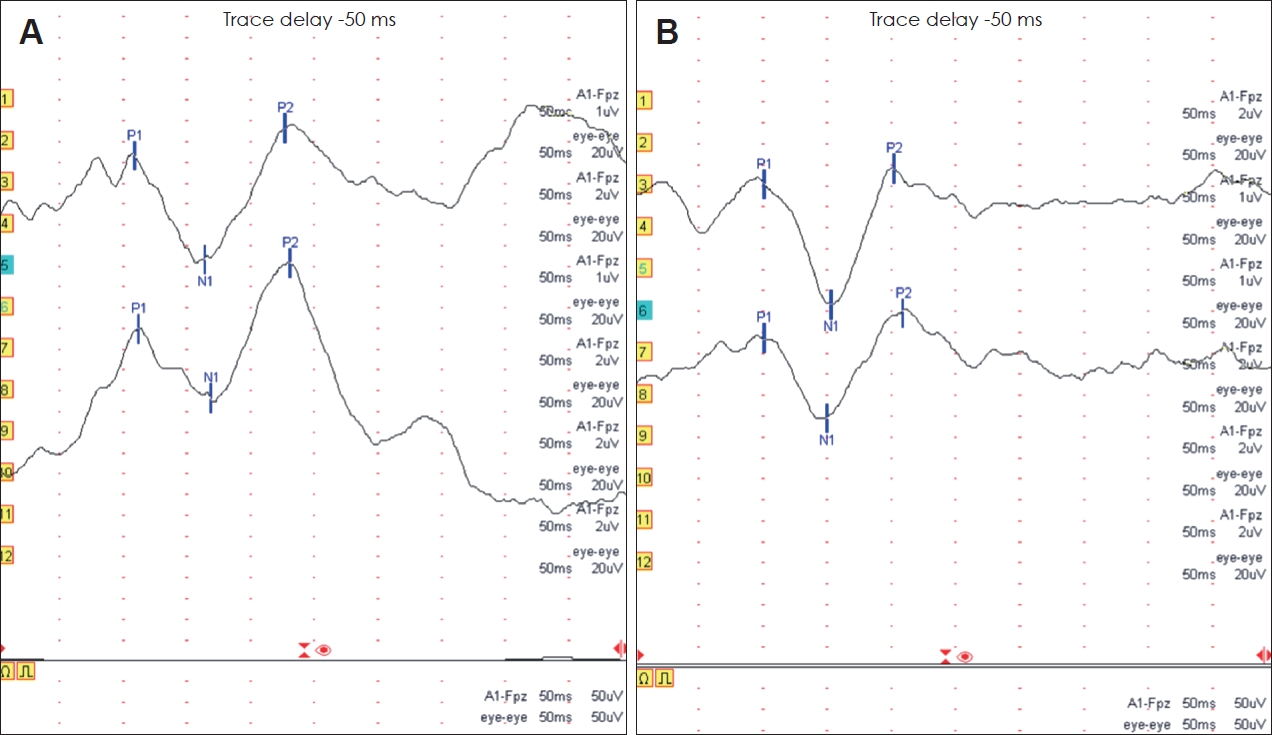
Typical CAEP waveforms recorded from a patient with a CI and a subject with normal hearing are presented in Fig. 1. Among the three waveform components of the CAEP, the P1 and N1 components were recorded in all patients with a CI. The P2 component was recorded in 85% of CI patients of group A, in 67% of CI patients of group B, in 67% of CI patients of group C. All three components of CAEPs were recorded in all the subjects with normal hearing.
Comparison of latencies of P1, N1, and P2 among patients with a CI
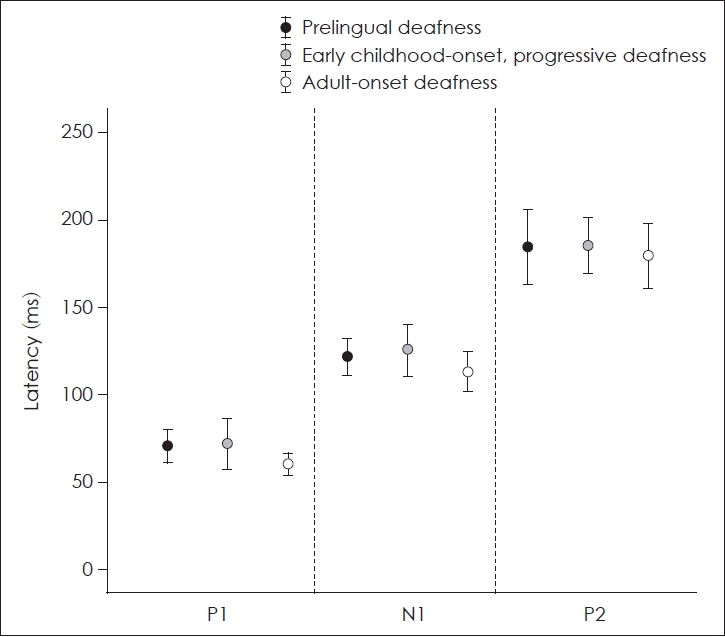
The mean latencies of P1, N1, and P2 of patients with a CI and control subjects with normal hearing were presented in Table 2. Mean latencies of P1, N1, and P2 of the patients of group C were the shortest among CI patients. However, there were no significant differences in the latencies of each component of CAEPs between the three groups of patients with a CI (p=0.109 for P1 latency, p=0.286 for N1 latency, p=0.866 for P2 latency; Kruskal-Wallis test) (Fig. 2).
Comparison of latencies of P1, N1, and P2 between patients with a CI and control participants with normal hearing
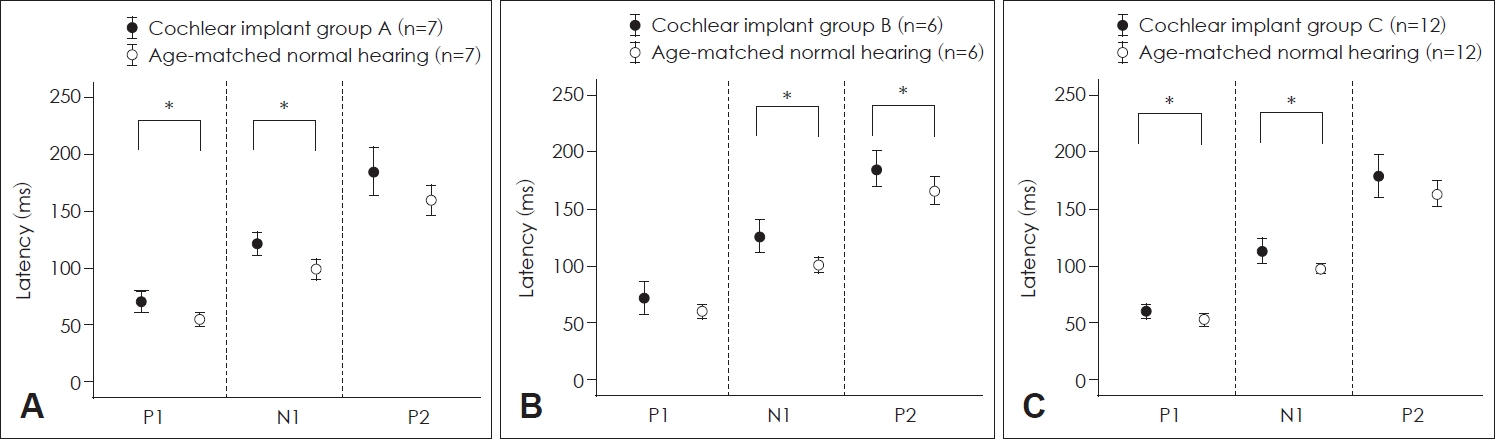
P1 and N1 latencies of CI patients in group A were significantly longer than those of control participants with normal hearing (p=0.001 for P1 latency and p=0.004 for N1 latency, Mann-Whitney test) (Fig. 3A). The P1 latency was not significantly different between CI patients in group B and control participants with normal hearing. However, N1 and P2 latencies of CI patients in group B were significantly longer than those of control participants (p=0.002 for N1 latency and p=0.038 for P2 latency; Mann–Whitney U test) (Fig. 3B). P1 and N1 latencies of CI patients in group C were significantly longer than those of control participants with normal hearing (p=0.027 for P1 latency and p=0.013 for N1 latency; independent t test) (Fig. 3C).
The relationship between latencies of P1, N1, and P2 and duration of deafness in patients with a CI
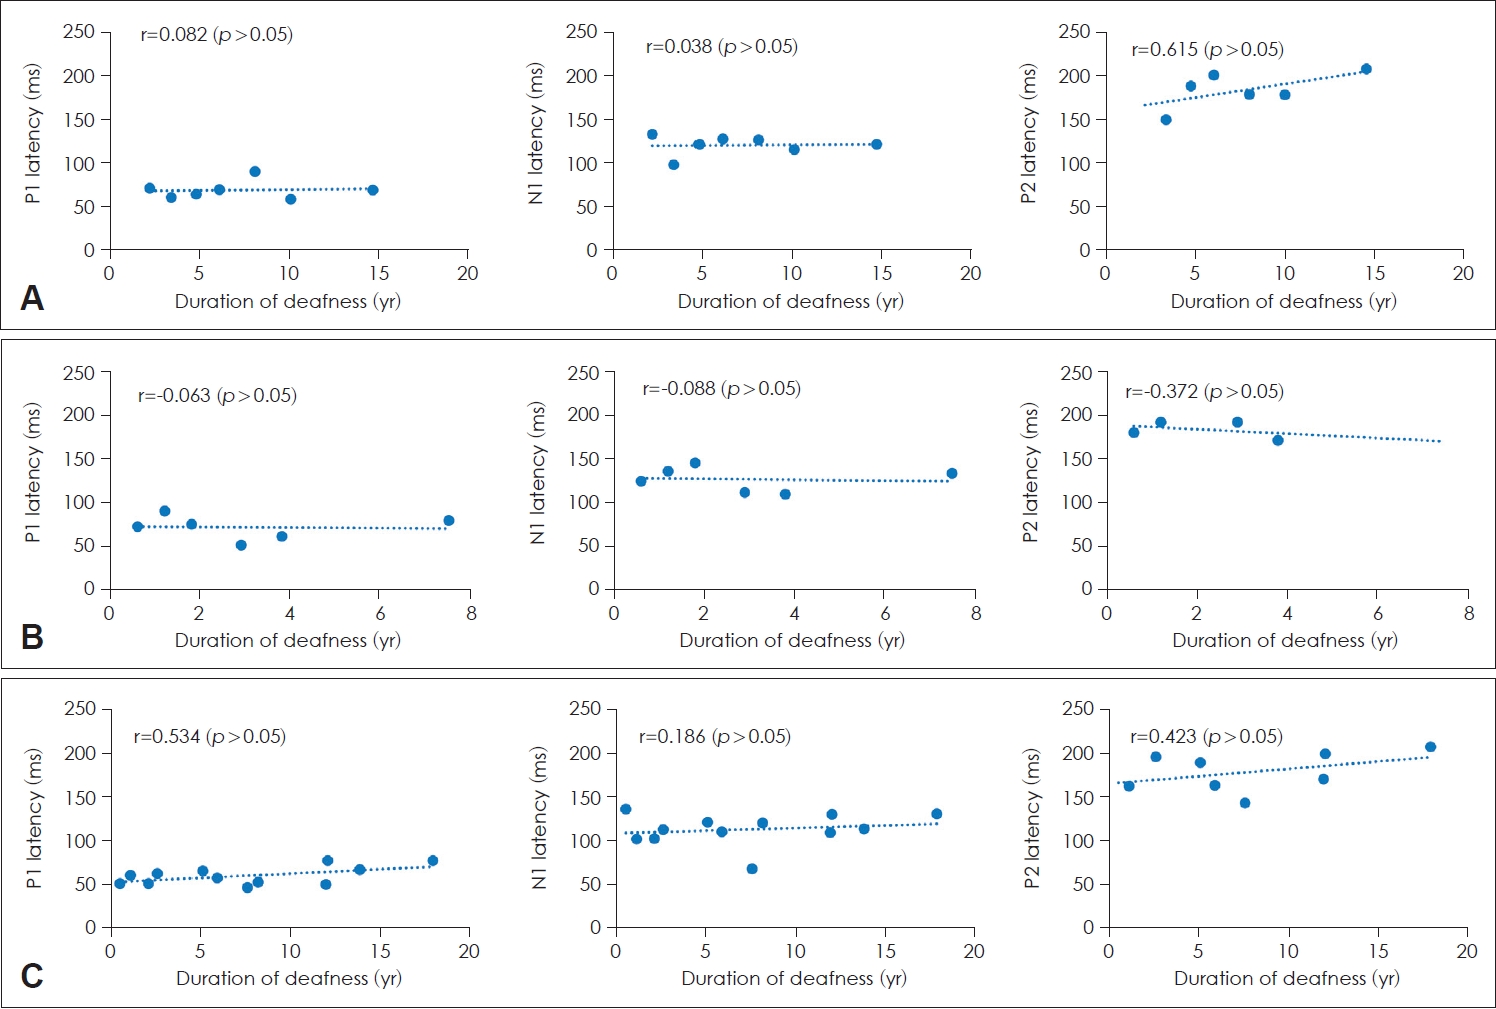
The relationship between the latencies of each component of CAEPs and the duration of deafness in patients with a CI was assessed using linear regression analysis. No significant correlations were found between the latencies of P1, N1, and P2 and duration of deafness in all three groups (Fig. 4).
Discussion
Neuroplasticity of brain is an important factor determining the outcome of CI surgery for deaf patients. Because there is a sensitive period of increased neuroplasticity during which auditory cortex is maximally plastic, the final outcome of cochlear implantation is optimal when it is performed during this period sensitive for auditory cortical development: i.e., within the first 1-3 years of life [6,13,14]. There have been several studies using CAEP measurements showing optimal auditory cortical development following early CI in congenitally deaf children [3,8,10]. However, most studies dealing with the effect of CIs on CAEP maturation in deaf children have used P1 CAEP as an indicator of auditory cortical development. Although P1 is a useful marker with which to represent the primary auditory cortex, it is dominant only during early childhood and does not represent the higher-order auditory areas. Our major concern is the status of the auditory cortex when it becomes fully developed as an adult rather than during childhood. N1-P2 components of CAEPs represent the higher-order auditory area and dominant CAEP components during adulthood [7]. Therefore, we measured P1-N1-P2 CAEPs in adult patients who had received a CI during childhood because of prelingual deafness or early childhood-onset, progressive deafness to investigate the final maturational status of their auditory cortex. In addition, adults who lost their hearing after fully developing their auditory cortex and who received CI were included in this study to examine the effect of auditory deprivation on the maturational status of the auditory cortex.
P1 and N1 were recorded from every adult patient with prelingual deafness who received CI during early childhood and P2 was recorded in about two-thirds of them. These findings show that deaf children who received CI can develop their primary and higher-order auditory areas through electrical stimulation provided by the CI. However, their P1 and N1 latencies were significantly prolonged compared with those of control participants with normal hearing, which implies that maturation of the primary and higher-order auditory areas of patients with CI who participated in this study, is less optimal than it is in individuals with normal hearing. The one of the main reasons for the latency delay may be that the participants received CI when relatively older. Previous studies showed that there was a positive correlation between the age at CI and P1 latency in deaf children who received CI during early childhood [3,15]. But the present study demonstrated that there was no significant correlation between P1, N1, or P2 latency and age at CI surgery.
The adult patients who had early childhood-onset, progressive deafness and who received CI during childhood showed clear P1, N1, and P2 responses. All of them had used hearing aids during early childhood because they had residual hearing at that time, and then received CI after losing their hearing progressively. Therefore, these patients may develop their auditory cortex with the aid of acoustic stimulation through hearing aids during early childhood and electrical stimulation through CI after losing their hearing. However, the maturational status of their auditory cortex seems worse than that of individuals with normal hearing as shown by their more prolonged N1 and P2 latencies.
Adults with late-onset deafness who received CI had significantly longer P1 and N1 latencies than control participants with normal hearing. This implies that the auditory cortex of adult patients with late-onset deafness undergoes degenerative change during any period of auditory deprivation. This finding is consistent with those of previous studies that have shown there is negative impact of the period of auditory deprivation on speech perception after cochlear implantation [4,16]. Therefore, in adults with late-onset deafness, it is better to receive a CI as soon as possible after losing hearing to avoid degenerative change of the auditory cortex.
The purpose of this study was to reveal the CAEP findings of adults with CIs who had various past medical history concerned with hearing status. This study has some limitations. First one is that the number of participants is not enough. Second one is that this study is a cross sectional study. A longitudinal follow-up study including larger number of patients is better to examine the maturational status of auditory area of brain using CAEP. Third one is that patients with a CI included in this study were not homogenous in terms of age at CI surgery and CI use duration. Future study will recruit a larger number of adult patients with a CI and age-matched subjects with normal hearing and follow them up for a long period to come up with more solid conclusion.
In conclusion, patients with prelingual deafness and those with early-childhood onset, progressive deafness who received CI developed a primary and higher-order auditory areas when they reached adulthood, as shown by clear measurement of P1-N1-P2 of CAEPs. However, the latencies of each component of CAEP were more prolonged than those in individuals with normal hearing, which implies suboptimal development of a higher-order auditory areas. Adult-onset deafness was associated with prolonged P1 and N1 latencies after CI than in control participants with normal hearing, which possibly originates from auditory cortex degeneration because of auditory deprivation before CI surgery.