


Introduction
Auditory localization is essential in day-to-day life. Identifying sound sources in the three-dimensional space is a crucial function of the auditory system, referred to as auditory spatial awareness. Auditory localization is essential to spatial awareness [1].
Spatial hearing is often regarded as a guiding system for vision in determining the source location and its position [2]. Spatial perception depends on the physiological status of the auditory system, including age and degree of hearing loss [3]. Assessment of spatial acuity is crucial in individual with deviant auditory physiology. Studies on auditory spatial perception mainly focus on understanding spatial processing ability and the cues that influence it [4-8]. Traditionally, localization is assessed in a sound-field environment, where sounds are emitted from several loudspeakers mounted at various azimuths and elevations around a sound-treated room [9-11]. Irving and Moore [10] presented broadband noise bursts from an array of 24 speakers spaced equally, spanning the 360° horizontal plane, to assess spatial acuity in normal-hearing adults fitted with a unilateral earplug. Another study assessed spatial acuity in a sound field with 18 speakers arranged in a circle with a radius of 1 m [12].
Assessing localization in a sound field is relatively popular as it more closely represents a real-world situation [10,13] where the binaural cues of interaural time difference (ITD) and interaural level difference (ILD) are easy to create. The monoaural spectral cues from pinnae and the head movement cues are unaltered. However, due to the high cost and technological sophistication, it is challenging to recreate such a setting in every clinic with the same reverberation characteristics.
Virtual methods are an alternate method for assessing spatial processing ability/localization. These experiments employ stimuli that are synthesized with the head-related transfer functions (HRTFs) from a person or a standard manikin (non-individualized HRTFs) and presented over headphones creating a virtual acoustic space (VAS). HRTFs produce distinct sound patterns by recreating the binaural cues of ITD and ILD. Along with monoaural head-shadow (spectral) cues under headphones that help the brain infer spatial properties of the sound, such as the distance and direction of arrival of sound in virtual space. The interplay of these cues creates a composite cue specific to each location and direction in space [14]. The use of virtual stimulus to assess spatial perception ability is more desirable as it is cost-effective, portable, flexible, and less technically sophisticated; hence will be more feasible in assessing spatial acuity in the clinical setup.
Virtual auditory space is an illusion of real field sound environment recreated in a closed field of a listener. It has been applied in several disciplines for assessing spatial perception ability [15,16].
More recently, Nisha and Kumar [12] developed the virtual auditory space identification (VASI) test to assess spatial acuity using virtual sources in a closed field. It involved presenting sounds from eight different virtual spatial locations (0°, +/- 45°, +/- 90°, +/- 135°, 180°) and assessing the spatial acuity. The stimulus was 250 ms white noise synthesized with non-individualized HRTFs using the sound module of the sound lab (SLAB 3D) software. The different virtual locations created were represented on a dummy head interface on the computer screen.
Thus studies show that spatial processing abilities can be assessed using the VAS. However, the extent to which the results replicate the real source (which more closely represents the real-world localization ability) and localization/spatial processing ability is unknown. Hence the present study compared the spatial processing ability in young adults using real sources with an array of loudspeakers in the sound field and with the virtual source method by creating VAS under headphones. The present study thus aims to compare the legitimacy of the two methods to assess spatial acuity.
Subjects and Method
The study’s objective was to assess young adults’ spatial acuity using two paradigms. Participants in the study included 55 adults between 18 and 30 years of age with normal and symmetrical hearing thresholds (not differing by more than 5 dB) in both ears [17], no prior history of listening problems, and other otological symptoms. All participants ensured normal hearing sensitivity and middle ear functioning through pure tone audiometry [18] and immittance audiometry [19]. The Screening Checklist for Auditory Processing in Adults (SCAP-A) [20] was administered to all the participants to rule out auditory processing deficits. Following the preliminary audiological evaluations, the participants were tested for their spatial acuity using two different paradigms: 1) localization test (a sound field paradigm) and 2) VASI test (a virtual paradigm). The materials and procedures of these paradigms are briefed in further sections. The order of these two test paradigms was counterbalanced among the participants.
Ethics and informed consent
Informed consent was obtained from the parents of all the study participants. The study was approved by the Institute Ethical Board of All India Institute of Speech and Hearing (ref: DOR.9.1/915/2020-21 with effect from January 9, 2023). All procedures in this study complied with the ethical guidelines of bio-behavioural research involving human subjects [21].
Stimuli
A 250 ms white noise was used as stimuli for both paradigms. The noise was generated with a sampling rate of 44,100 Hz, and the cosine ramped with a rise and fall of 10 ms. The noise was generated with a custom MATLAB code (MATLAB Ver 2014a; The MathWorks Inc., Natick, MA, USA). The signal was normalized and saved as a .wav output file for a further presentation in the localization and virtual paradigms [12].
The localization tests paradigm
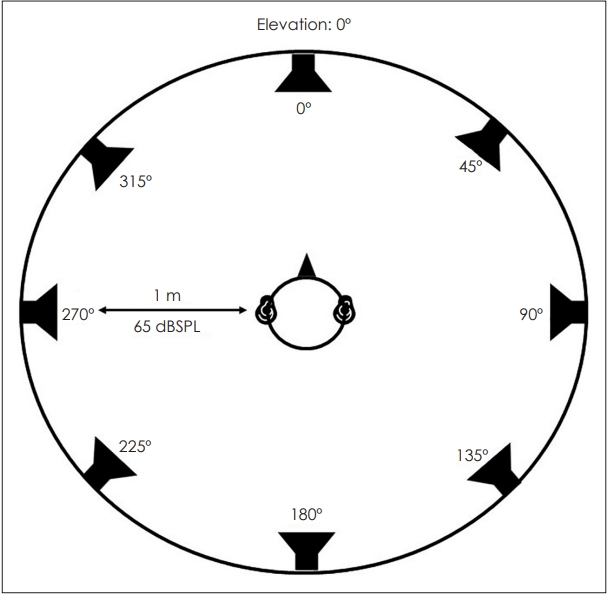
The sound field paradigm included eight speakers (Genelec 8020B BI-amplified monitoring system, Iisalmi, Finland) mounted at an elevation of 0° and placed at a distance of 1 m from the listener in a chamber of dimensions 5.2×6.4×3 meters (17×21×10 feet) built with sound absorbing materials to reduce reverberation and echoes. The Genelec 8010A speakers has a output frequency response of 67 Hz–25 kHz at -6 dB attenuation. The eights speakers mark eight different azimuths, 0°, 45°, 90°, 135°, 180°, 225°, 270°, and 315°, in a clockwise direction at the horizontal plane (Fig. 1). The eight speakers were connected to the desktop via Lynx Studio Technology’s multi-channel amplifier (Lynx Studio Technology, Inc., Costa Mesa, CA, USA). A set of 10 stimuli were presented at each azimuth, and the order of presentation was randomized across the azimuths. The participant was instructed to sit comfortably facing speaker no. 1, marking 0° azimuth, not to move their head during stimulus presentation and had to respond by naming the speaker number of the presented stimuli [22]. The responses were recorded and stored using a custom MATLAB code. Later the responses were exported and used for calculating confusion matrices. The localization test was conducted in an air-conditioned, acoustically treated double room that meets the ANSI S3.1 (1999) guidelines and standards [7]. The stimuli were presented at 65 dBSPL and verified using a Knowles Electronics Manikin for Acoustic Research (KEMAR) and a sound level meter. The participants were instructed clearly about the procedure, and no practice trials were given.
The virtual auditory space identification test paradigm
The virtual sound source paradigm employs a personal computer and high-fidelity headphones (Senheiser HD 569, Germany) to perform spatial acuity tests. The stimuli were virtually spatialized with a spacialization module called SLAB Scape, implemented in SLAB 3D v6.8.3 software. SLAB Scape is a graphical user interface that renders an audio-visual virtual environment [23]. The software is an open-source tool available at http://slab3d.sonisphere.com. The SLAB Scape allows the user to use HRTF to render sound sources at different virtual locations. The default SLAB 3D HRTF database, “jdm.slh” was used in this study. SLAB 3D HRTF databases contain 143 pairs of head-related impulse response (HRIR) and ITD filter data for spatial rendering. It provides data on an azimuth grid of 180 to -180 in -30° increments and an elevation grid of 90 to -90 in -18° increments. The HRIRs were sampled at 44,100 Hz and 128 data points. So it provides the best resolution for spatial rendering. Also, the acoustic characteristics of the test room used to conduct the localization parameter were considered while rendering the spatialized sound sources in SLAB 3D. Since the subject in the localization paradigm was made to sit in the centre of a sound-absorbing chamber with dimensions 5.2×6.4×3 meters, the most reflective surfaces are relatively far from the listener, and reflections are diffuse for all source positions. Hence the absorption coefficient was considered to be 0.99, and reverberation spectra were considered negligible. So, the same properties were replicated in the Scape module of SLAB 3D while generating spatialized sound sources.
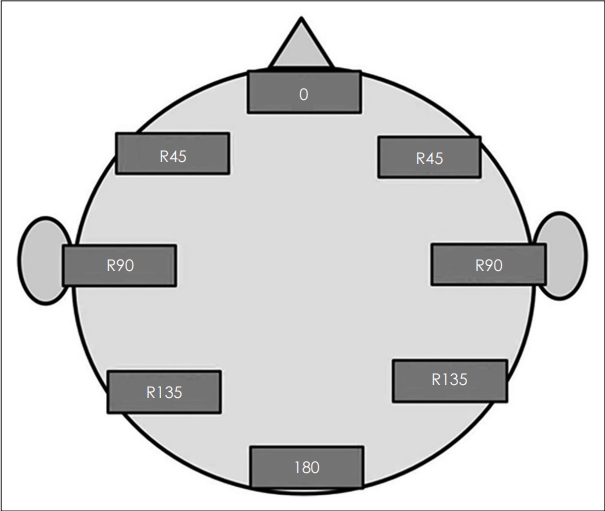
The 250 ms white noise generated using MATLAB was imported to the Scape module and sounded with different azimuths (0°, right 45°, right 90°, right 135°, 180°, left 45°, left 90°, left 135°) were rendered. The rendered output was saved and exported as .wav files with names corresponding to the azimuths. The exported stimuli files created the VASI test paradigm in Paradigm Software (Ver 2.5; Perception Research Systems Incorp., Lawrence, KS, USA). The test paradigm randomly presents the stimuli at different azimuths, accounting for ten trials each. The participant must listen through a headphone (Senheiser HD 569), identify and locate the sound source in a visual head model presented after each trial (Fig. 2) [24]. The responses are recorded and exported as .xml files for calculating confusion matrices. The stimuli were presented at 65 dBSPL and verified using a KEMAR and a sound level meter. The participants were instructed clearly about the procedure, and practice trials were given before the experimental trials.
Scoring and analysis
The confusion matrices for eight locations with the localization and VASI tests were calculated separately for each participant using a custom MATLAB code. Tables 1 and 2 show the mean confusion matrix for the localization and VASI tests. The first row in the confusion matrix indicates the azimuths presented, and the first column indicates the azimuth identified by the participant. The tables indicate, at each location, the number of times the participant identified the presented azimuth as a particular location; for example, the value corresponding to row 1 and column 1 indicates the number of time sound presented at 0° was identified as 0°; similarly, row 2 and column 2 indicates the number of time sound presented at 0° was identified as 45°. The value in each cell will be out of a maximum score, such as 10 in the localization paradigm and 5 in the virtual paradigm. Only five presentations were made in the virtual paradigm because familiarization trials were presented at all locations before test trials, so restricting the number of test trials would help reduce test time and avoid fatigue. Then, the accuracy scores of each location (0°, right 45°, right 90°, right 135°, 180°, left 45°, left 90°, left 135°) and the overall accuracy scores were calculated and tabulated from the confusion matrices. The number of times a presented azimuth was correctly identified gave the accuracy scores at each location, and the sum of accuracy scores at all locations in a particular paradigm gave the overall accuracy scores. Further, various localization error rates were also calculated and tabulated; right intra-hemifield errors (errors from confusion at right 45°, right 90°, right 135° azimuths), left intrahemifield errors (errors from confusion at left 45°, left 90°, left 135°), inter-hemifield errors, and front-back errors. Since the maximum score at each location for the localization test was 10, and that of the VASI test was 5, to aid in statistical comparison between the paradigms, the raw accuracy scores and error rates were converted into rationalized arcsine units (RAU). The RAU was calculated using the conversion provided by Studebaker [25]. Readers can refer to Studebaker (1985) for further details about the conversion. The RAUs were used for further statistical analyses and comparison.
Results
The demographic details of the participants are tabulated in Table 3. The RAU’s accuracy scores at each azimuth, overall accuracy, and error rates with the localization and VASI tests were tabulated and subjected to statistical analyses.
Statistical analysis
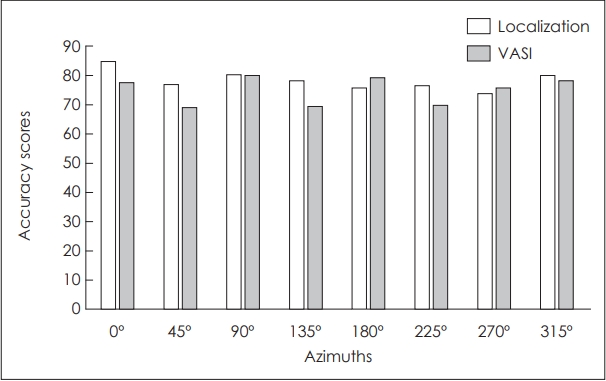
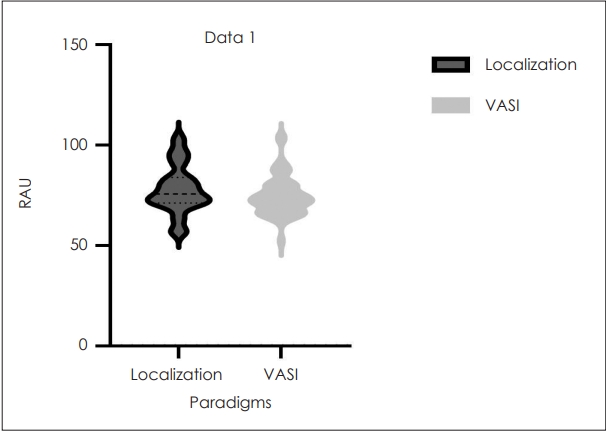
Descriptive statistics show that the median RAU accuracy scores across azimuths in the localization test were marginally higher than in the VASI test (Fig. 3), and so was the RAU of overall accuracy scores (Fig. 4). A similar outcome is seen in error rates—the localization errors were marginally less than in the VASI test. The front-back errors in both paradigms were zero.
The Shapiro-Wilk test for normality showed that the data did not follow a normal distribution. Hence non-parametric tests were chosen to carry out inferential statistical analyses.
Comparing the accuracy scores and error rates between the paradigms quantifies differences, the two-paradigm yields. So, it might support the usage of a virtual paradigm as an alternative to a real-world paradigm. Hence the Wilcoxon signedrank test, a significance test for a within-subject design, was used to evaluate the hypothesis that the location-specific accuracy scores, overall accuracy, and error rates (dependent variables) were different in the two paradigms (independent variable). Also, since the comparison was made at the accuracy scores of each location, an appropriate Bonferroni correction was made in the p-value. Also, to augment the Wilcoxon signed-rank test findings, Spearman correlation, a non-parametric test, was used to correlate the scores of localization and VASI.
Comparison of accuracy scores and error rates
Wilcoxon sign rank test showed that the accuracy scores (in RAU) at various locations (0°, right 45°, right 90°, right 135°, 180°, left 45°, left 90°, left 135°) and the overall accuracy scores (in RAU) using the localization test and VASI test were not significantly different (Table 4 ). Further, various localization error rates like right intra-hemifield errors (errors from confusion at right 45°, right 90°, right 135° azimuths), left intra-hemifield errors (errors from confusion at left 45°, left 90°, left 135°), and inter-hemifield errors, were also not significantly different in both paradigms (Table 5).
Correlation of accuracy scores and error rates
Spearman’s rank correlation showed that the location-spe-cific accuracy scores, overall accuracy scores, and various errors between the two paradigms had mild to moderate correlation. Tables 6 and 7 show the Spearman’s correlation coefficient (rho) between the two paradigms across different parameters.
Discussion
Traditional sound source localization paradigms involve presenting isolated sounds through speakers in an anechoic chamber, which is costly, sophisticated, and practically challenging. Hence this study made a preliminary attempt to employ a virtual sound source identification paradigm to assess spatial acuity and compare it with the traditional free-field sound source localization paradigm. Though several studies have used real-field and virtual paradigms to assess auditory spatial processing, there is no direct comparison between them. It is expected to obtain the same outcome in both localization and virtual paradigms, as both assess the same processing ability and methodologically similar. The current study compared accuracy scores specific to sound locations at a resolution of 45°, overall accuracy scores, and various localization errors between real field (localization test) and virtually closed field paradigms (VASI test).
There was only mild to moderate correlation between the scores of the localization test and VASI, which implies that the real field and a virtual space differ in providing auditory cues for localization, per se. The spectral cues could be lacking in the VASI, which recreates the virtual space using an HRTF rather than providing real field cues. The location-specific and overall accuracy scores in the localization test were better than the VASI test, but it was not statistically significant. Hence, the VASI test’s performance is comparable to the localization test in assessing spatial acuity. The right intra-hemifield errors, left intra-hemifield errors, and inter-hemifield errors were also less in the localization test than in the VASI test; but were statistically insignificant. The front-back errors in both the localization test and VASI were zero. Hence the confusions experienced by a listener in the localization test and the VASI test were similar. So, the performance of VASI is equivalent to the localization test. The current study reflects that the virtually closed field paradigm can be an alternative to the sound field paradigm.
Further, a virtual paradigm facilitates flexibility. It is easier to manipulate the acoustic environment in a virtual field than in a real field. Using a single source in a localization paradigm often overestimates spatial processing abilities because a realworld auditory experience involves a much more complex acoustic environment than a single sound source [26]. Using a virtual paradigm makes it feasible to alter the presented acoustic environment by allowing multiple sound sources, complex acoustic scenes, manipulation of reverberation characteristics, and many other technical possibilities.
In conclusion, it is evident from the current study that the VASI performs equally to a sound field localization paradigm in assessing spatial acuity. Based on the findings, we recommend using VASI testing as it has practical implications due to its cost-effectiveness, need for minimal equipment, and accuracy in documenting spatial errors (similar to the loudspeaker free-field paradigm). A further experiment is warranted to establish its validity in the clinical population as a test for spatial acuity.