


Introduction
Hearing impairment is one of the most prevailing conditions found in older adults. And it is noteworthy that one of the most recommended rehabilitation options for individuals with hearing impairment is hearing aids resulting in improved social and emotional functioning [1]. However, surprisingly, less than one-fourth of individuals with hearing impairment have been seen to use hearing aids [2,3]. The lack of usage of hearing aids has been shown to have adverse negative effects on quality of life, resulting in social isolation in individuals and sometimes leading to depression [4]. McCormack and Fortnum [5] reported that some potential reasons for not using hearing aids are due to the lack of perceived benefit and difficulty in perception in the presence of background noise. The overall hearing aid-fitting process includes several components, such as the selection of appropriate hearing aids with features matching the needs of the individual, verification of the fitting, and validation of real-world performance. The challenges the clinician faces in selecting appropriate individual-specific hearing aids and the dissatisfaction reported by the individual post-fitting can be reduced using a prehearing aid fitting test battery. This would aid clinicians in deciding appropriate hearing aid technologies through individual predictions made using the performance on the prehearing aid fitting tests. In the current clinical scenario, the most common tests included in the prehearing aid test battery are pure tone audiometry and word recognition measures with and without hearing aids. However, there is a need to include other measures, such as speech understanding in quiet and in noise, loudness discomfort, and patient expectations, among many, as a part of the prehearing aid fitting procedure. There are contradicting findings reported in the literature about the relation between these measures and subjective satisfaction with hearing aids. It is essential to understand that the hearing aid benefit and hearing aid satisfaction are two different outcome measures of hearing aid. Studies that compared speech recognition results in quiet to the hearing aid satisfaction outcome measure revealed no significant relation between the two [6-8]. This evidence shows the disadvantage of the standard measure used to evaluate hearing aid benefits in individuals with hearing impairment.
Further, a few found a significant correlation when the scores on speech recognition in noise were correlated with hearing aid satisfaction measures [9-11]. At the same time, a few studies reported no correlation between the two measures [8,12]. Although there is a corpus of measures to assess hearing aid benefits, the relation with subjective satisfaction in using hearing aids remains undetermined. The hearing aid benefit is usually evaluated using objective measures, while the satisfaction is subjective and varies across individuals. Contradicting reports in the literature might be majorly due to the discrepancies between the objective and subjective measures. These discrepancies were reported to be reduced with tests such as the “Perceptual Performance Test (PPT),” which measures outcome information on subjective and objective domains. This would provide information on the hearing aid benefit and satisfaction from the same test using the same test materials to avoid discrepancies seen in earlier studies. The test outcomes assist clinicians in identifying participants based on normative values that under/overestimate their ability to understand speech in noise [11,13]. This estimation of their ability can be used for counseling during or after the hearing aid fitting process. Although PPT has been shown to have substantial potential to influence the practical benefit obtained by individuals from hearing aids, it is not available in Indian languages to be used in Indian scenarios. Thus, it is necessary to adapt the PPT procedure in regional languages to incorporate it into the audiological test battery in India. Hence, the current study aimed at bridging the gap between objective and subjective measures of hearing benefit by using a single test to assess both. The study also aimed to adapt and validate the PPT procedure in Malayalam language. The relation between the PPT measures and self-reported measures of hearing handicaps was also evaluated.
Subjects and Methods
The study was carried out in two phases. Phase I involved adapting the PPT procedure in the Malayalam language using standardized Malayalam sentences and obtaining normative values. Phase II was administering the adapted test procedure to individuals with hearing impairment.
Participants
Sixty-five native Malayalam speakers between 19 and 73 years (mean=52.7 years; standard deviation=27.6 years) participated in the study. The sample size was calculated using G*Power software [14] with α level as 0.05, β=0.95 and the effect size from a similar study [11]. The sample size calculated using G*Power ranged from 15 to 18 participants in each group. Based on the above calculated sample size, the number of participants was selected for the present study. None of the participants chosen had any history of neurological, cognitive, speech, or language problems. All of them had normal middle ear functioning confirmed through visual inspection using an otoscope and “A” type tympanogram in impedance audiometry. Among them, 30 had normal hearing sensitivity documented through normal pure tone air and bone conduction thresholds from 250 Hz to 8,000 Hz (hearing thresholds ≤10 dB HL between 500–4,000 Hz and ≤15 dB HL at 6 kHz and 8 kHz). They were included only if the speech identification scores exceeded 95%. Individuals with hearing impairment (n=35) were chosen to have bilateral sensorineural hearing loss with symmetrical thresholds (interaural threshold difference <15 dB). Only individuals having hearing thresholds of ≥20 dB HL from 0.25 kHz to ≤2 kHz and not ≤75 dB HL from 4 kHz to 8 kHz were included in the present study. The participants with hearing loss were included only if they had ≥70% speech identification scores. Depending on whether or not they use hearing aids, the participants were divided into two groups: those with hearing loss who do not use aids (n=15) and who are hearing aid users (n=20).
Material
Written permission was obtained from the original test author to adapt and validate PPT in the Malayalam language. The standardized Malayalam sentences developed by Rajisha [15] were used as stimuli. Eleven sentence lists, each containing ten sentences with equal difficulty and a similar number of words with semantically neutral content, were selected for the study. All the sentences represented conversational speech having a proper verb and were familiar. The sentences were uttered by a female native Malayalam speaker in a flat intonation and were recorded according to the ANSI S3.1., 1999 (R 2013) guidelines. Additionally, an 8-talker babble was recorded by employing eight native Malayalam speakers using Praat software (version 6.1.16, https://www.fon.hum.uva.nl/praat/) by placing the microphone in the center at an equal distance from all eight speakers. The recording was further segmented and assigned to different sentences. The digitalized waveforms of the recordings were normalized using Audacity software (version 3.1; https://www.audacityteam.org/), and the root mean square was equated to 60 dB.
Procedure
Initially, written informed consent was obtained from all the participants before initiating the test procedure. Further, ethical clearance was obtained from the Institutional Review Board of JSS Institute of Speech and Hearing (JSSISH/257 (a) 2022-23/17-07-22). The research is compliant with ethical standards according to the 2013 Helsinki Declaration. All the participants were subjected to diagnostic audiological tests, including pure tone audiometry and immittance evaluation. Those who met the inclusion criteria in the above tests were further evaluated using PPT, Hearing Handicap Inventory for the Elderly (HHIE) [16] or Adults (HHIA) [17]. For the adapted PPT using Malayalam sentences, the adaptive procedure described by Saunders and Forsline [13] was followed to present the stimuli. Each participant was randomly given two lists of sentences with babble from the available 11 lists. The order of lists and sentences within the list was counterbalanced across participants and conditions. The speech stimuli and babble were presented simultaneously from a laptop connected to a 2-channel audiometer through the loudspeaker at 0° azimuths placed at 1 m from the participant. For the PPT, two speech recognition thresholds in noise (SRTN) were obtained: performance SRTN and perceptual SRTN. Initially, for perceptual SRTN, the participants were told to listen to the sentences in the presence of background noise and to respond with a “yes” or “no,” depending on whether they understood the content of the sentence or not. However, during the SRTN performance, the participants were asked to verbally repeat the sentences presented in the presence of background noise. They were asked to repeat whatever they heard, even if it was only a part of the sentence. The adaptive process was the same for both measurements; however, the presentation level for noise was fixed, but the level of speech varied according to the responses. The sentence was presented initially at 4 dB below the noise level. It was reduced further in 4 dB steps for the following four sentences, and 2 dB steps were used for later sentences if the participant repeated or understood the whole sentence. The participants were tested at three noise levels: 40, 55, and 70 dB HL. The signal-to-noise ratio (SNR) at which the participant could repeat 50% of the sentences presented correctly was calculated as the performance SRTN. In contrast, the SNR at which the participant responded by saying “yes” for all the sentences presented, indicating a complete understanding of all the sentences, was noted as the perceptual SRTN. A third measure, the Performance-Perceptual Discrepancy (PPDIS), was established by calculating the difference between the performance SRTN and perceptual SRTN by subtracting the abovementioned SRTNs. This indicates the accuracy with which the participant judges their hearing ability. A negative PPDIS suggested that the subject selected a better SNR than required to perform and is termed underestimation. At the same time, a positive value indicates that the subject chose a more adverse SNR than necessary and is termed an overestimation.
Additionally, the HHIE [16] or HHIA [17] were administered to individuals over the age of 65 or below 65 years, respectively. The only difference between the two companion questionnaires is the wording of three items. Based on age, each participant answered the 25-item questionnaire evaluating hearing loss’s social and emotional effects.
Statistical analyses
The IBM SPSS software (version 21; IBM Corp., Armonk, NY, USA) was used for descriptive and inferential statistics. The Shapiro-Wilk test of normality showed that the data were normally distributed; hence parametric statistics were carried out. Initially, a two-way repeated measures analysis of variance (ANOVA) was done to examine the effect of the group (normal hearing, hearing impaired hearing aid users, and hearing impaired who do not use hearing aids) and noise level on perceptual and performance SRTNs and PPDIS. Further, post hoc analyses were done if a significant main or interaction effect was found. Pearson’s correlation coefficient was used to determine the relation between the measures of the PPT (PPDIS, perceptual and performance SRTNs) and the HHIE/HHIA scores. Additionally, the test-retest reliability was estimated using Pearson’s correlation coefficient. In addition, normative criteria for PPDIS were established based on the criterion used in the literature [11,18]. Those who scored ≤-1.3 dB were categorized as under-estimators and ≥0.77 dB as over-estimators. Those who fell in between these two values were classified as accurate estimators.
Results
The results of the present study are provided regarding comparing the PPT response measures across the three groups of participants and three noise presentation levels. Similarly, the effect of noise presentation level and difference across groups are given for PPDIS values. Further, the relation between the reported handicap through the HHIE/HHIA subscale and the measures of the PPT are elucidated in detail.
Comparison of PPT responses across the groups for various noise levels
Perceptual and performance SRTNs
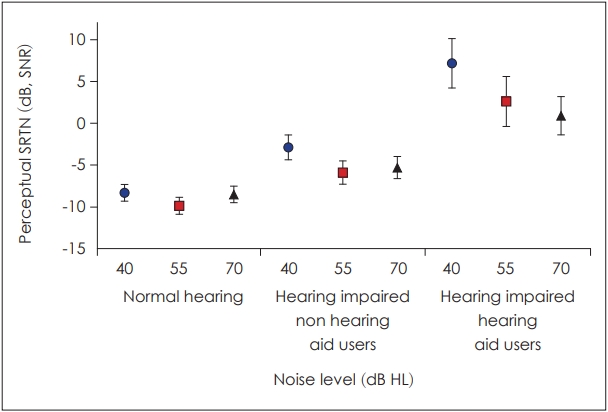
The mean and standard deviation of performance SRTNs and perceptual SRTNs are illustrated in Figs. 1 and 2, respectively. The mean of all three participant groups showed an influence of noise presentation level, i.e., higher noise presentation levels yielded better results. This was seen for both perceptual SRTNs as well as performance SRTNs and was prominently observed in individuals using a hearing aid.
A repeated measures ANOVA was carried out for both perceptual and performance SRTNs to confirm whether this difference was statistically significant. The results revealed that for perceptual SRTNs, there was a significant main effect of groups [F(2, 65)=61.01, p<0.001], presentation level [F(2, 65)=51.8, p<0.001], as well as the interaction between the group and presentation level [F(2, 65)=14.6, p<0.001]. Similarly, for performance SRTNs, there was a significant main effect of groups [F(2, 65)=51.01, p<0.001], presentation level [F(2, 65)=41.3, p<0.001], as well as the interaction between the group and presentation level [F(2, 65)=14.3, p<0.001]. Further, the post-hoc analysis was done to check whether there was a significant difference between groups, and the results are given in Tables 1 and 2. It can be seen that there was a significant difference between all groups for both the perceptual and performance SRTNs (p<0.001). When the analysis was done to check whether the noise presentation level differed within each group, the results showed a significant effect of noise level was not seen within the normal hearing group (p>0.05), while the other two groups containing individuals with hearing impairment showed a significant effect of noise (p<0.001). This was seen for both the perceptual and performance SRTNs.
Performance-perceptual discrepancy
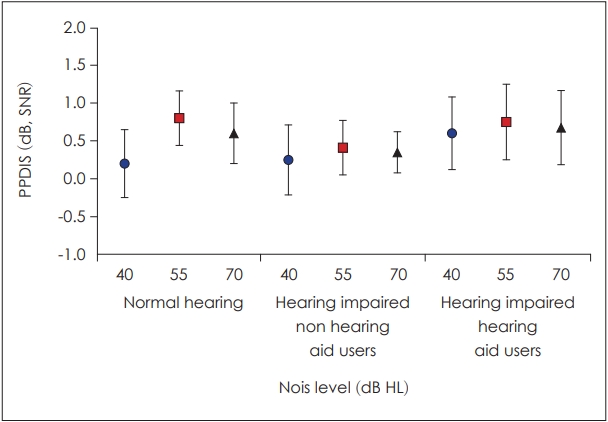
The PPDIS scores were seen to be normally distributed around the mean for all three noise levels, i.e., 40, 55, and 70 dB HL. The mean PPDIS value obtained by each group, along with the standard deviation, is illustrated in Fig. 3. A repeated measures ANOVA was done to check whether the groups varied significantly in PPDIS values. The results showed there was no significant main effect of the group [F(2, 65)=2.9, p>0.05], presentation level [F(2, 65)=1.76, p>0.05]. Also, there was no significant interaction found between the group and the presentation level [F(2, 65)=2.38, p>0.05] on PPDIS values.
Relation between the measures of the PPT and HHIE/HHIA scores
Correlation across the measures of the PPT
A Pearson’s correlation coefficient (r) was done to check the relation between the perceptual SRTNs, the performance SRTNs, and the PPDIS values. The results revealed a significant correlation between the perceptual and performance SRTNs at all presentation levels (Table 3). However, the PPDIS did not significantly correlate with the perceptual SRTN (Table 3). At the same time, it had a slight positive correlation with performance SRTN at 55 dB HL and a moderate positive correlation at 70 dB HL noise level.
Correlation between the measures of the PPT and HHIE/HHIA scores
The relation between the HHIE/HHIA subscales and the PPT subtests was analyzed using Pearson’s correlation coefficient. The results showed a good correlation between perceptual and performance SRTNs with emotional and social subscales and the total HHIE/HHIA scores (Table 4). However, there was a negative correlation between PPDIS and the HHIE/HHIA scales. Also, the correlation did not reach statistical significance except at the 55 dB HL presentation level.
Discussion
The results of the present study showed that the participants with normal hearing sensitivity performed better than both groups of individuals with hearing impairment (with and without hearing aids). This was seen for performance as well as perceptual SRTNs at all three noise levels (40, 55, and 70 dB HL) used in the present study. The results of the present study add to the corpus of evidence in the literature that ability to understand speech in the presence of noise is affected to a greater extent in individuals with hearing impairment when compared to individuals with normal hearing [19,20]. Further, it is noteworthy that among the individuals with hearing impairment, those without hearing aids performed better than those with hearing aids and could understand speech better at more adverse SNRs. As the hearing-impaired participants in the current study had moderate to severe hearing loss, the influence of audibility rather than the SNR may have resulted in significantly better performance at higher noise levels among those who were not using hearing aids. The findings also indicate that, even with hearing aids, those with hearing loss have a reduced ability than people with normal hearing to perceive speech in noise.
Further, the effect of noise presentation level was seen significantly within the group with hearing impairment and not in individuals with normal hearing for both performances as well as perceptual SRTNs. This might be the case for those with normal hearing because speech would have been clear and undistorted at any level of noise presentation, but it might not be for people with hearing impairment. Further, among those with hearing impairment, it was surprisingly observed that those who do not use hearing aids performed and perceived better at more adverse SNR than those with hearing aids. In other words, people without hearing aids heard speech more clearly at a noise presentation level of 70 dB HL than at levels 40 and 55 dB HL. This could be due to the influence of the audibility factor in those individuals with hearing impairment who do not use hearing aids. It should be noted that the audibility of both speech and noise signals would have been poor for individuals without hearing aids, irrespective of the SNR. The influence of the SNR can be considered only when the speech or noise signals are audible. When there is an insufficient intensity to hear the speech signal, neither audibility nor the SNR contributes to the performance. As the hearing-impaired participants in the current study had moderate to severe hearing loss, the effect of audibility rather than the SNR might have led to much better perception and performance at higher noise levels in those without hearing aids. Similar results have been reported in a study by Saunders and Forsline [11], although the noise levels differ from the current study. Based on the findings of the previous studies as well as those of the present study, it can be postulated that speech perception in noise results aid in predicting the satisfaction of using hearing aids to a greater extent than the current measures such as aided thresholds and aided speech perception that are employed.
On the other hand, the PPDIS normative value established in the current study was used to categorize individuals with hearing impairment as under-estimators, over-estimators, and correct estimators. The findings revealed that 13 participants were under-estimators, 10 were over-estimators, and 12 were accurate estimators. Additionally, the under-estimators performed worse at higher SNRs, whereas the over-estimators performed better at lower SNRs. This indicates that the perception of the individual and the performance are related. In this regard, Saunders and Forsline [11] have speculated that the PPDIS values are representative of self-judgements of one’s abilities in general, but it is not particular to the listening scenario or the auditory ability alone. This supposition was made using a comparison of the aided PPDIS values to unaided as well as the scores of personality tests. This shows that the test can directly compare the individual’s ability to judge speech perception through hearing aids and the actual performance using the same hearing aid. This information would be of great importance in individually predicting the hearing aid outcome. Further, it can also be utilized in counseling individuals with hearing impairment about their judgment about perception and the actual performance obtained through the hearing aids. Hence, the above findings demonstrate the importance of PPDIS as a reliable measure in estimating an individual’s speech perception in the presence of noise through hearing aids.
There was a good correlation between perceptual and performance SRTNs with emotional and social subscales and the total HHIE/HHIA scores. However, there was a negative correlation between PPDIS and the HHIE/HHIA scales. Also, the correlation did not reach statistical significance except at 55 dB HL presentation level. Although a significant correlation was found, the correlation’s strength was observed to be low at 55 dB HL. Significant variation in the reported handicap as determined by the HHIE/HHIA is explained by the PPT measures, performance, perceptual SRTNs, and PPDIS. In particular, the reported handicap comprises performance and perception components, equally important to individuals with hearing impairment. In other terms, the reported handicap appears to be explained as much by an individual’s perception or misperception of their hearing abilities as by the measured performance. These correlations are negative, meaning that regardless of the participant groups (i.e., those with normal hearing or hearing impairment), those who report more significant disabilities tend to underestimate their hearing ability. People who perceive less disability, in contrast, tend to overestimate their hearing capacity. Similar reports have been given in earlier research that people tend to underestimate their hearing aid use and express dissatisfaction with it compared to those who report fewer handicaps when completing the self-reported surveys [11,13]. Thus, it can be observed that irrespective of hearing ability, individual judgement about perception skills play a major role in hearing aid satisfaction. Hence, these results need to be analyzed and utilized while counseling patients who complain of a greater amount of difficulty than expected for their degree of hearing loss as well as with those who, despite having a significant hearing loss, claim they have no hearing issues. Further, good test-retest reliability was obtained, which shows that reliable responses were obtained during both the performance SRTN and perceptual SRTN across administrations. It is advantageous, but also perhaps unexpected, those subjects are equally reliable when performing the perceptual task as they are when performing the performance task. Hence, it indicates that the PPT adapted for the Malayalam language can be used as a reliable tool in assessing speech perception in noise post-hearing aid fitting.
In the present clinical practice, the other basis for reported hearing handicaps in individuals with hearing impairment remains unexplained, as only the hearing-related component is measured in general. The results of the present study indicate that the PPT adapted in Malayalam is a valid and reliable tool for measuring the outcome of hearing aids in assessing speech perception in noise post-hearing aid fitting. The findings imply that assessing the effectiveness of hearing aids depends critically on whether the hearing ability is underestimated or overestimated. Since the PPDIS can offer the clinician an explanation for the gap between objective and subjective reports of hearing impairments, the PPT can provide more information than a performance measure or a subjective measure alone. This can be employed to reduce the discrepancy between individuals’ expectations for how well hearing aids might function and what can really be attained and further counseled about the same. This might lessen the general frustration that individuals with hearing loss express with their hearing aids.