


Introduction
Auditory-visual (AV) processing binds information from two different sensory modalities, and its occurrence is not felt most of the times in day-to-day life. Binding information from two different modalities helps our auditory perceptual system in reducing noise and enhancing the salience of the target stimuli. This reduction in the noise in turn allows for an easy division between successive events and separation of target from the background noise. For example, listeners perceive speech better at lesser signal-to-noise ratios when the visual information supplements the auditory signal. Also, when the visual signal is present, listeners detect auditory signal at much lower intensities. The effect of visual signal on auditory perception can be evidenced by a classic illusion called McGurk effect [1]. McGurk and MacDonald [1] found that, when a face articulating /ga/ is dubbed with a voice saying /ba/, listeners perceive the consonant /da/. The acoustic speech signal was heard as another consonant when dubbed with incongruent visual speech, even though it was recognized well in isolation. Since, the percept differs from the acoustic and visual components, it is called the fusion effect [1]. Later studies showed that different types of percepts are produced other than fusion responses when the auditory and visual stimuli are incongruent [2,3]. It can lead to percept of another speech sound with similar place of articulation [3] or can just lead to percept of visual component alone [2]. Thus, of late, McGurk effect is considered as a categorical change in auditory perception induced by incongruent visual speech, resulting in a single percept of hearing something other than what the auditory stimulus is conveying [4].
While listening to incongruent stimuli, listeners may give more weight to auditory or visual information depending on the relative importance/salience of the two. It is thought that when auditory information is more reliable than the visual information, auditory-oriented percept is elicited. Similarly, when visual information is more reliable than auditory information, a visually-oriented percept is evoked. When both modalities are informative to the same extent, a fusion or a combination percept is elicited. The strength of AV integration can be determined by one modality enhancing the other, one modality biasing the other, or by the creation of strong illusory effects.
Even though McGurk illusion has been considered a robust effect, there is a wide range of variability seen across individuals in literature [5-7]. These studies report McGurk effect ranging from zero to hundred percent. However, many of the above-mentioned studies have pooled the responses across all AV consonant combinations irrespective of the consonant class or category, i.e., voiced and unvoiced stops, fricatives, or nasals. However, there is some evidence to show that McGurk effect could be different for different consonant categories such as voiced, unvoiced, fricatives or nasals. Colin, et al. [8] compared the fusion and combination responses between voiced and unvoiced consonants and showed that combination responses were significantly more in unvoiced compared to voiced consonants. There was no difference between the two consonant classes in terms of fusion responses. However, MacDonald and McGurk [9] reported higher fusion percepts for voiced incongruent AV stimuli than with no differences in combination responses for voiced and unvoiced AV stimuli. Contrary to this, more fusion percepts were reported for unvoiced consonants than voiced consonants by Sekiyama and Tokura [10]. However, the motive of these studies were not to compare the McGurk percept among different consonant classes. Moreover, all these studies have been carried out on Western/Japanese listeners. A considerable amount of evidence suggests that linguistic structure of language modulates the McGurk percepts in terms of frequency of occurrence [11,12]. The occurrence of McGurk illusion has been less studied with respect to Indian languages. Kannada is a Dravidian language spoken in a southern state of India and has a different phonetic characteristics compared to the languages in which McGurk percepts were studied so far. Specifically, Kannada is one among the Indian languages which have a retroflex stop consonant (/ṭ/ & /ḍ/) and a retroflex nasal consonant (/ṇ/) which is not present in many of the other languages of the world [13]. These inherent differences in the phonetic structure of the language might influence the perception of AV syllables differentially compared to other languages where McGurk perception has been evaluated. Evaluating AV perception across different consonant combinations will allow us to infer the effect of inherent properties of acoustic and visual signals on perception of amount of fusion or McGurk responses. Thus, the primary aim of the study was to compare the amount of McGurk responses across three different consonant combinations: 1) /ba/ & /ga/ (voiced stops), 2) /pa/ & /ka/ (unvoiced stops), and 3) /ma/ & /ṇa/ (nasals) in participants who speak Kannada language. We hypothesize that the amount of McGurk effect would vary across these consonant combinations due to different acoustic properties and visibility of the syllables according to the weightage given to specific modality. Due to large amount of variability seen in the McGurk responses some of the recent studies have used different criteria to consider presence of McGurk effect in participants. For example, Benoit, et al. [5] have considered participants with more than 50% McGurk responses, whereas Roa Romero, et al. [14] included participants having more than 15% McGurk responses to understand the neural dynamics of McGurk effect. Similarly, Venezia, et al. [15] and van Wassenhove, et al. [3] considered more than 25% and 40% McGurk responses respectively to evaluate temporal dependencies of McGurk effect. However, there are no consensus among the studies in defining the criteria, which is arbitrarily selected varying across different studies. Therefore, we considered classifying the participants more statistically using cluster analysis, also considering the auditory oriented responses which is more data-driven. However, although there are not many studies using cluster analysis in AV perception, few speech and language perception studies have used cluster analysis in classifying [16]. In addition, this study also assessed whether there is any relationship between unimodal identification of consonants (auditory alone and visual alone) and the fusion responses in Kannada. Earlier studies have demonstrated that the identification accuracy of unisensory components is reflected into audiovisual speech perception [10,17,18]. Therefore, it is important to consider unisensory perception as well. Studies have shown that the perception of fusion responses largely depends on the clarity of visual components even though the McGurk stimuli were of a fusion type [19,20]. The models of AV integration argue that extracting information from unimodal signals is important, which modulates the perception of fusion responses [21,22]. Although the visual properties of the bilabials are similar across all the three consonant combinations, the visual properties of velars (/ga/ & /ka) and retroflex (/ṇa/) are different. When the acoustic properties of these syllables are considered, each of the syllable have unique characteristics. The retroflex nasal (/ṇa/) syllable is unique to the Kannada language, which is absent in most of the Indian languages too. Hence, we hypothesize that the inherent acoustic and visual characteristics of each syllable should have differential effect on the identification of unimodal stimulus and also should these effects be inferred to the amount of McGurk effect perceived. Thus, we evaluated how the unimodal identification of these consonants would be modulating the amount of McGurk responses for these consonant combinations.
Subjects and Methods
Participants
A total of twenty-eight participants in the age-range of 18-28 years participated in the study. Using a self-reported questionnaire their demographic details were obtained. All the participants were right-handed, as per Edinburg’s handedness inventory. None of the participants had any history/presence of gross neurological, otological, or psychological problems. Their hearing thresholds were within 15 dB HL at octave frequencies from 250 Hz to 8,000 Hz. All the participants had 90% to 100% speech identification scores. Informed written consent was obtained from all the participants prior to inclusion in the study after obtaining approval and ethical clearance certificate from the All India Institute of Speech and Hearing Ethics Committee (Ref No. WF-0251/2014-15 dated 12.11.2015). All of them had normal visual acuity as measured on the Snellen chart.
Stimuli
The stimuli consisted of six naturally spoken consonantvowel (CV) syllables; unvoiced bilabial stop /pa/, unvoiced velar stop /ka/, voiced bilabial stop /ba/, voiced velar stop /ga/, bilabial nasal /ma/ and retroflex nasal /ṇa/. The consonant pairs were chosen such that they belonged to three different consonant classes: voiced (/ba/ & /ga/), unvoiced (/pa/ & /ka/), and nasals (/ma/ & /ṇa/). The six CV syllables uttered by a male Kannada language speaker were videotaped using a video camera (Nikon D5300, Nikon Inc., Tokyo, Japan) fixed on a tripod at zero-degree azimuth. The speaker had Indian ethnicity with fair complexion. The speaker was chosen from a total of eight speakers based on the highest ratings obtained on a five-point rating scale which included parameters such as intelligibility, clarity (good pronunciation), visibility (clear articulation of syllables visually), naturalness (normal vocal effort), loudness and overall quality. The acoustic analysis of the spoken syllable also showed clear waveform and spectrogram pertaining to the selselected speaker. The video was focused on the speaker’s face uttering the syllable with a uniform black background. The audio was recorded separately using a Behringer B-2 PRO condenser microphone (MUSIC Tribe Global Brands Ltd., Willich, Germany) connected to a laptop through a Microbook II (Motu Inc., Cambridge, MA, USA). The recordings were made with a digitization rate of 44,100 Hz and a resolution of 16-bit in Adobe Audition (Adobe Systems Inc., San Jose, CA, USA). This was done to eliminate the video camera noise that is present in default microphone of the camera.
Each video of the syllable began and ended in a neutral position; closed mouth. The speaker uttered each syllable three times in a neutral intonation with normal pronunciation and vocal effort. Out of three recordings, one recording which contained clearly articulated syllable with clean waveform and spectrogram was considered further for the experiment. The same was done for all the six syllables.
The videotaped syllables were then separated into audio and video stimuli using VideoPad Video Editor (Version 4.05, NCH Software, Canberra, Austrailia). The video recording was edited into 720/576 pixel resolution at 25 frames/sec (1 frame=40 ms) digitization rate. The separately recorded auditory syllables were placed in the position of the original audio of the video recordings. These recordings constituted six congruent AV syllables: AVba, AVga, AVpa, AVka, AVma, and AVṇa. The audio alone syllables were generated by dubbing the auditory counterpart of the AV syllable to the still face of the speaker. The visual alone condition had the video of the speaker uttering the syllables with no audio. In addition, a separate set of 3 incongruent stimuli were designed to elicit the McGurk percepts. To generate these stimuli, the audio of the syllables with the most anterior place of articulation was dubbed onto the video of the syllables with most posterior place of articulation in a consonant class. Thus, the audio of naturally produced /ba/ was dubbed onto a video of the face saying /ga/. Similarly, audio of /pa/ and /ma/ were dubbed onto a video of a face saying /ka/ and /ṇa/ respectively. These three McGurk pairs along with six congruent CV syllables resulted in a total of nine AV stimulus pairs. Along with nine AV stimulus pairs, there were six each of audio alone and visual alone syllables making a total of twenty-one stimuli. Table 1 summarizes the stimuli used in the experiment.
Procedure
The audio-visual speech identification experiment was designed and carried out using Presentation version 17.0 (Neurobehavioral Systems Inc., Berkeley, CA, USA). The participants were seated on a comfortable chair in front of the 21-inch visual display screen (VIEWPixx, Saint-Bruno, QC, Canada). The videos of each syllable were displayed on the screen at a rate of 25 frames/sec. The experiment was carried out in a sound-treated double room with ambient noise levels within permissible limits. The syllables were presented at 70 dB SPL through speakers kept at 0° azimuth and 1 m distance from the participants. Before the actual tasks, all participants underwent a familiarization phase where they were presented with the nine audio-visual CV syllables twice.
Participants watched and/or listened to the stimuli and identified syllables from a closed set of three forced choices. Of the three choices, one was the syllable corresponding to the video and the other was corresponding to the audio of the stimuli, and the third choice was another syllable from the same consonant class (voiced, unvoiced, and nasal). When the syllable was AV/ba/ or any voiced syllables, the participant was presented with choices which included /ba/, /ga/, and /da or ḍa/. If it was an unvoiced syllable, such as, AV/pa/, participants had to choose from /pa/, /ka/, /ta or ṭa/. Whereas, during the presentation of nasal syllables (e.g., AV/ma/), the choices included /ma/, /ṇa/ (as in /haṇa/, which means money) and /na/ (as in /ʤana/, which means people). Participants were instructed to press the appropriate key corresponding to their choice on a response pad. Each syllable was iterated 10 times in each condition. All the conditions were presented randomly in a block. Presentation of stimulus and collection of the responses were controlled by Presentation software. The participants’ response was noted for each syllable in every condition. Only correct responses were scored for all the conditions except for the incongruent AV condition. For the incongruent condition, the responses were scored as auditory oriented and McGurk responses. Of late it has been claimed that the McGurk effect is a single percept where there is a change in auditory perception due to the presence of an incongruent visual stimuli [2,4] and it has been adopted by several studies [8,23]. Thus, any responses other than the auditory counterpart were considered as McGurk responses for the incongruent condition. These values were tabulated for further statistical analysis.
Results
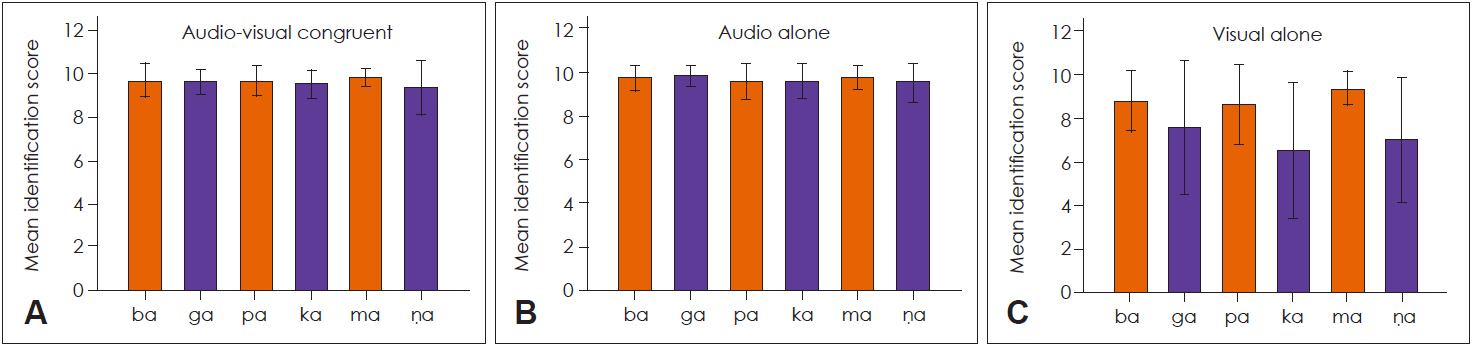
Mean identification scores were calculated separately for the three consonant combinations (ba/ga, pa/ka, and ma/ṇa) and for four different conditions (AV congruent, AV incongruent, audio alone, and visual alone). In case of incongruent syllables, mean identification scores were obtained for two percepts, i.e., McGurk responses (any percept other than the auditory-oriented responses) and auditory-oriented responses. The mean identification scores for congruent, audio alone and visual alone conditions across the three consonant class are shown in Fig. 1.
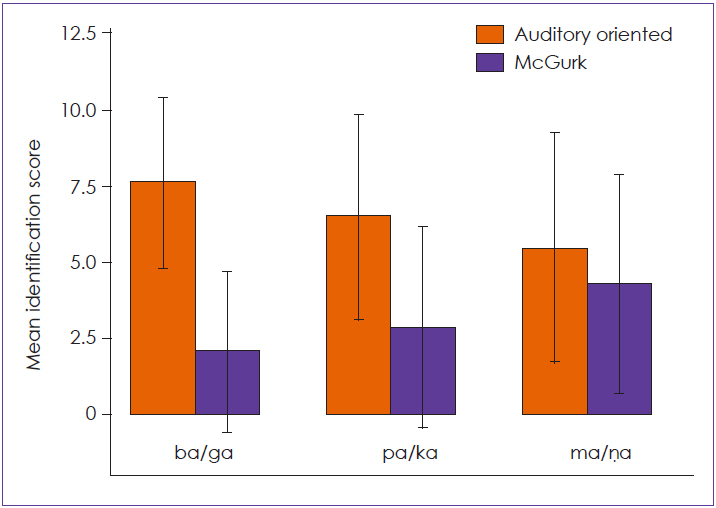
The identification scores for all the consonants were near perfect for congruent and audio alone conditions. The identification scores for congruent conditions were not compared across different consonant classes, as it was already high and was not the purpose of our study. The mean identification scores in the visual alone condition were higher for the bilabial syllables than the velar and retroflex syllables in all consonant combinations. Within the bilabial syllables, /ma/ had higher mean identification score than /ba/ and /ga/. There were confusions in the identification of /ga/, /ka/, and /ṇa/ in visual alone condition. Moreover, individual variability was higher in the identification scores of visual alone syllables. The identification scores of incongruent McGurk AV syllable for all the participants and consonant pairs are shown in Fig. 2.
The mean auditory-oriented responses were higher than the McGurk responses for ba/ga and pa/ka incongruent AV syllables. But, in case of ma/ṇa incongruent syllables, the auditory-oriented and McGurk responses were almost similar, even though the mean appears higher for auditory oriented responses. Of the twenty-eight individuals, twenty-four individuals demonstrated McGurk percept for ma/ṇa (syllable identified as other than the auditory signal) while only seventeen showed McGurk percept for the ba/ga and pa/ka incongruent syllables. However, considerable individual variations were seen in the McGurk percept across three consonant combinations ranging from 10% to 100%. Therefore, a cluster analysis was carried out to arrive at two groups. This was done by considering the individual auditory-oriented and McGurk identification scores of ba/ga, pa/ka and ma/ṇa incongruent syllables. A K-means cluster analysis grouped the data into two clusters; Cluster 1 having ten individuals and, Cluster 2 with eighteen individuals. Cluster 1 (Cluster centers: ba/ga=5, pa/ka=6, and ma/ṇa=8) constituted individuals who had higher McGurk responses than individuals in Cluster 2 (Cluster centers: ba/ga=1, pa/ka=1, and ma/ṇa=2). Mean auditory oriented responses and McGurk responses across different consonant combinations in the two clusters are shown in Fig. 3A.
In Cluster 2, the auditory-oriented responses were higher than McGurk responses (Fig. 3). Whereas in Cluster 1, McGurk responses were higher than auditory-oriented responses (Cluster 1 centers: ba/ga=5, pa/ka=3, ma/ṇa=1; Cluster 2 centers: ba/ga=9, pa/ka=8, ma/ṇa=8). This trend was similar across the three consonant combinations. Although the McGurk responses were below 25%, there was a systematic increase from ba/ga to pa/ka to ma/ṇa syllable combinations irrespective of clusters. Comparison of McGurk responses across the three consonant combinations in Cluster 1 revealed a significant main effect on Friedman’s ANOVA (χ2(2)=7.58, p=0.023). Post-hoc analysis using Wilcoxon signed-rank test showed significant difference in McGurk responses between ba/ga and ma/ṇa consonant combination (Z=-2.615, p=0.009, r=-0.59), and also between pa/ka and ma/ṇa consonant combination (Z=-2.108, p=0.035, r=-0.47). But there was no significant difference between ba/ga and pa/ka consonant combination (Z=-1.394, p=0.163, r=-0.3) in terms of McGurk responses. It should be noted that the non-parametric statistics are used as the number of participants in Cluster 1 are only ten and the data was not normally distributed. Friedman’s ANOVA showed a significant effect of consonant class on McGurk responses in the Cluster 2 as well (χ2(2)=7.127, p=0.028). Post-hoc Wilcoxon signed-rank test showed significant difference in McGurk responses between ba/ga and ma/ṇa (Z=-2.502, p=0.012, r=-0.42), and also between pa/ka and ma/ṇa (Z=-2.053, p=0.04, r=-0.34). Whereas, no significant difference was noted in McGurk responses between the ba/ga and pa/ka syllable combination (Z=-0.586, p=0.558, r=-0.09).
It is believed that one of the factors responsible for the inter-subject variability in the McGurk percept is the perception of unimodal (visual alone & audio alone) stimulus. To investigate this effect, audio alone and visual alone scores were compared between Cluster1 (high McGurk responses) and Cluster 2 (low McGurk responses) using Mann-Whitney U test. There was no significant difference in the audio alone responses between Cluster 1 and Cluster 2 for all speech sounds. When visual alone responses were compared between the two clusters, there were no significant differences for all consonant combinations except ma/ṇa combination (scatterplots depicting visual alone responses vs. McGurk responses are shown in Fig. 4).
In case of ma/ṇa, individuals in Cluster 2 had significantly higher identification scores than individuals in Cluster 1 (Fig. 3B, Table 2). Pearson’s Product-Moment correlation showed a significant negative correlation between the McGurk responses for ma/ṇa combination and /ṇa/ visual alone identification (r= -0.61, p=0.001). This means that the individuals who had good McGurk percept for ma/ṇa consonant combination had poor /ṇa/ visual alone identification and vice versa.
Discussion
The McGurk responses showed wide inter-subject variability in general, which varied from 0% to 100% irrespective of the consonant classes. Intra-subject and inter-subject variability in the McGurk responses to incongruent AV stimulus is well documented [5-7]. In the present study, it was interesting to note that the susceptibility of an individual to the McGurk effect varied based on consonant combinations. 60.7% of the participants showed McGurk percepts for ba/ga and pa/ka syllable combinations, whereas a greater percentage of individuals (85.7%) were susceptible to McGurk effect for ma/ṇa consonant combination. To our knowledge, this is the first systematic study of the effect of consonant combinations on McGurk percept in Kannada language. Sekiyama and Tohkura [10] also found greater illusion using unvoiced (pa/ka) than voiced (ba/ga) syllables in the Japanese language. A study reported contradicting results where they found higher fusion responses to voiced than unvoiced syllables [9]. However, the aim of their study was not to compare illusion responses between voiced and unvoiced syllables. These earlier studies have obtained open-set or closed-set responses with a large number of choices, which might have shown an effect on reporting of fusion responses [6]. It was intriguing that among the individuals who had McGurk effect, all of them did not have McGurk effect for all the three consonant combinations. Only 46.43% of the 28 participants showed McGurk responses for all the three consonant combinations. Among the individuals who exhibited McGurk responses, some showed McGurk responses only for a single consonant combination; 25, 3.57, and 3.57% for ma/ṇa, ba/ga, and pa/ka consonant combination, respectively. The percentage of individuals in whom McGurk responses were observed in either of the two consonant combinations were 7.14% (both for pa/ka & ma/ṇa), 7.14% (both for ba/ga & ma/ṇa) and 3.57% (both for ba/ga & pa/ka). One participant did not exhibit McGurk responses for any of the consonant combinations. Within the group of individuals who exhibited McGurk responses for different consonant combinations, the amount of McGurk responses varied from 10% to 100% (Fig. 2).
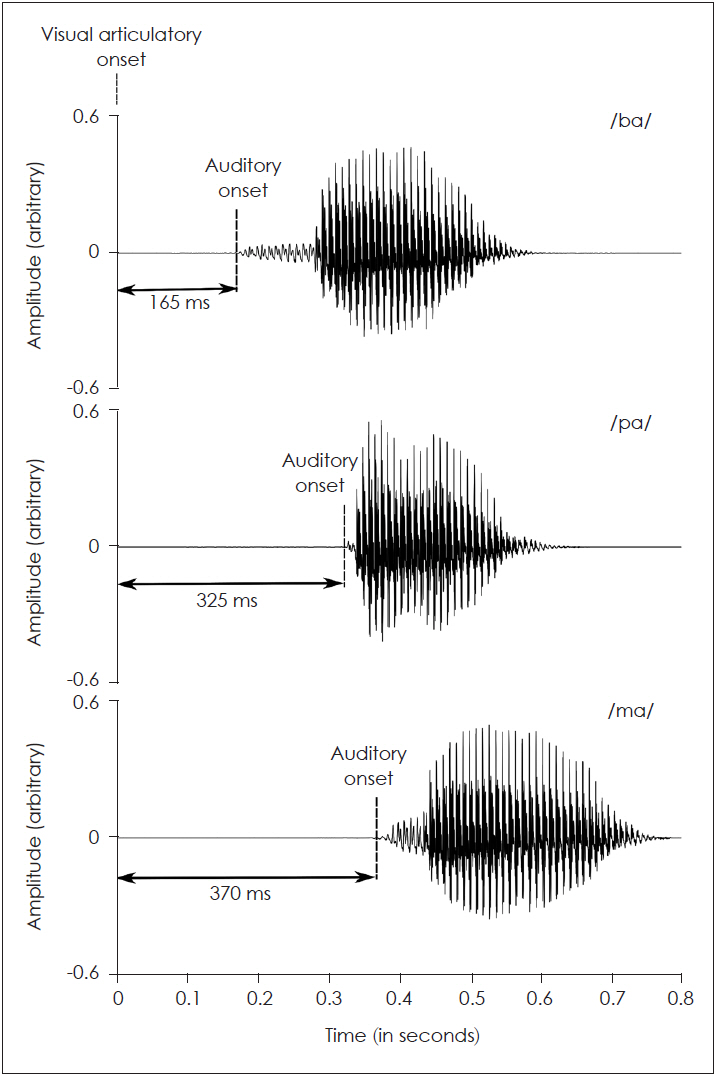
Cluster analysis performed to classify the group into two clusters showed one with high (Cluster 1) and another with low (Cluster 2) McGurk scores. Significantly higher McGurk responses were seen for ma/ṇa when compared to ba/ga consonant combination in both the clusters. The physiological reason for this finding is not clear. Fig. 5 shows the acoustic waveform of three consonants used to generate incongruent stimuli along with the time point of onset of the articulatory gesture.
It has been evidenced by a study that the fusion effects occur as early as -30 ms (auditory lead) of temporal asynchrony [3,15]. This suggests that the inherent phonetic properties of the acoustic stimuli will have an effect on the perception of fusion responses. The ma/ṇa combination might have higher McGurk responses because the auditory stimulus had ~70 ms of nasal murmur. Further, out of the three consonant combinations studied here, nasal consonants are reported to be perceptually more salient and resistant to the effects of noise [24,25].
Another explanation can be, the phonemic and phono-tactic rules in the Kannada language. The frequency of occurrence of sound /n/ is higher in Kannada language when compared to other sounds [26,27]. This might have increased the perception of McGurk responses of nasals due to the linguistic experience of the participant. Secondly, sound /ṇ/ never occurs in the initial position in the Kannada language which is not true with /k/ and /g/ sounds. This would have caused more visual confusions with respect to /ṇa/ syllable that increases the tendency of responses towards the most frequently occurring sound /na/ (based on previous linguistic experience). However, literature shows that perception of fusion responses is not influenced by the linguistic experience of sounds occurring in the initial or final positions [28]. Hence, the linguistic experience alone, cannot completely explain the results obtained in the present study. Thus we examined whether the onset of the visual articulatory gestures and auditory syllables can explain the results. The auditory syllable onset-time relative to the visual articulatory onset-time was shortest in the ba/ga syllable (+165 ms) followed by pa/ka syllable (+325 ms), and ma/ṇa syllable combination (+370 ms) (Fig. 5). Higher difference between the visual and auditory onset in ma/ṇa syllable would have facilitated clearer perception of visual syllable resulting in higher fusion responses. If it is the time difference between the auditory and visual-onset that is responsible, even pa/ka syllable should have had significantly higher fusion responses, which should have further led to no significant differences in McGurk responses between ma/ṇa and pa/ka syllable combinations. But when we considered the visibility of the articulatory movements within ma/ṇa and pa/ka syllables, /ṇa/ has an anterior place of articulation when compared to /ka/, which makes it more salient visually than an unvoiced syllable. The higher auditory and visual salience of ma/ṇa syllables compared to ba/ga and pa/ka syllables might have led to higher McGurk responses. Thus, the results suggest that the perceptual salience of both auditory and visual signals is important in the perception of fusion responses. Greater auditory and visual perceptual salience will lead to more fusions in the perception of ma/ṇa than the ba/ga and pa/ka consonant combinations.
According to Fuzzy Logical Model of Perception (FLMP), the perception of unimodal sensory stimulus is important and the percept after combining the information from two sensory input depends on the perceptual weights given to the two sensory information based on various factors [22,29]. Similarly, predictive coding frameworks also emphasize that multimodal speech perception is dependent on the salience of unimodal sensory stimulus [30]. But the earlier studies which have compared voiced and unvoiced consonants have not considered the unimodal auditory and visual responses to explain the differences. Colin, et al. [8] have attributed the differences that were found between voiced and unvoiced consonant to the confusions in the identification of auditory-only velar consonants. But in the present study, unimodal auditory identification scores were 90-100% across all three consonant combinations and there were no significant differences in audio alone scores between the two clusters. Thus, identification of unimodal auditory stimulus might not be a factor influencing the differences in the McGurk responses between the consonant combinations in the two clusters in the present study. This indicates that the perception of unimodal visual syllables must have an effect on the perception of McGurk responses. According to FLMP, unimodal identification of the visual syllables should also be better if it has to lead to fusion percept, as the audio alone responses are already good. This suggests that the cluster with higher McGurk responses (Cluster 1) should have greater visual unimodal accuracy and the cluster with low McGurk responses (Cluster 2) should have lower visual unimodal accuracy. But when we observed the visual alone responses for both the clusters, the results were contradicting for both velar (/ga/ and /ka/) and retroflex (ṇa) consonants. The cluster in which individuals had lower McGurk responses showed higher unimodal visual identification accuracy (Fig. 3). Greater confusions in the identification of visual only syllables were consistent in a cluster of individuals with higher McGurk responses. But this pattern was significant only for the ma/ṇa consonant combination and did not reach significance for ba/ga and pa/ka consonant combinations. The significance might have emerged only for the ma/ṇa consonant combination, because higher McGurk responses were seen for ma/ṇa combination in Cluster 1. The large difference in McGurk scores between Cluster 1 and Cluster 2 would have led to the clearer differences in the pattern of visual alone responses. The larger McGurk responses for ma/ṇa consonant combination are because of both phonetic and visual salience in the incongruent stimuli as discussed earlier.
Altogether these results suggest that, better unisensory identifications may not result in AV integration resulting in illusions, but inferences made in the brain by analyzing the incoming sensory stimuli based on various factors, supporting the idea of predictive coding in AV integration [30]. This suggests that, better identification of unimodal signals might not completely explain the McGurk effect seen in an individual. But the characteristics underlying the individual sensory inputs in an AV signal aids the brain in making inferences about the final percept. The differences in the inherent acoustic properties of the syllables might result in differing sizes of the Mc Gurk effect. When the visual signal is considered, confusions in the perception of the place of articulation might instigate the brain in drawing the inferences about the final percept, which might lead to illusions. There might be other factors such as previous experiences, attentional processes and linguistic background that contribute to the final inference of the percept. The amount of attention given to the auditory and/or visual counterparts influences the perception of fusion [20], which contributes to the individual variability seen in perception of McGurk effect. Previous experiences includes an individual’s ability to lip read and syllable perception in presence of noise, will also have an influence on the final percept. The linguistic structure might influence as the McGurk effect appears more frequently when the consonant occurs with vowel /i/ than /a/. However, the present study has evaluated McGurk effect using only vowel /a/ with the consonant. Thus, the results of the present study confines to the particular CV combination in Kannada language uttered by a single talker, which cannot be generalized, forming the limitation of the study.
The present study compared the amount of McGurk effect across ba/ga, pa/ka, and ma/ṇa consonant combinations by grouping them into individuals with high and low McGurk scores. Differences were noted in the amount of McGurk effect between ba/ga and ma/ṇa syllable combinations in both the groups. When unimodal identifications were compared across these two groups, auditory alone identification did not contribute to the differences seen in the McGurk scores. However, visual alone identification showed a distinguishable pattern across the two groups. The results suggest that the unimodal identification scores altogether may not provide an exact reflection of the McGurk effect evidenced. But inferences are made out of other factors that contribute to the final percept.