Warning: mkdir(): Permission denied in /home/virtual/lib/view_data.php on line 87 Warning: chmod() expects exactly 2 parameters, 3 given in /home/virtual/lib/view_data.php on line 88 Warning: fopen(/home/virtual/audiology/journal/upload/ip_log/ip_log_2024-10.txt): failed to open stream: No such file or directory in /home/virtual/lib/view_data.php on line 95 Warning: fwrite() expects parameter 1 to be resource, boolean given in /home/virtual/lib/view_data.php on line 96 Influence of Stimulus Polarity on the Auditory Brainstem Response From Level-Specific Chirp
J Audiol Otol Search

CLOSE


J Audiol Otol > Volume 25(4); 2021 > Article
Dzulkarnain, Salamat, Shahrudin, Jamal, and Zakaria: Influence of Stimulus Polarity on the Auditory Brainstem Response From Level-Specific Chirp

Abstract

Background and Objectives

No known studies have investigated the influence of stimulus polarity on the Auditory Brainstem Response (ABR) elicited from level-specific (LS) chirp. This study is important as it provides a better understanding of the stimulus polarity selection for ABR elicited from LS chirp stimulus. We explored the influence of stimulus polarity on the ABR from LS chirp compared to the ABR from click at 80 dBnHL in normal-hearing adults.

Subjects and Methods

Nineteen adults with normal hearing participated. The ABRs were acquired using click and LS chirp stimuli using three stimulus polarities (rarefaction, condensation, and alternating) at 80 dBnHL. The ABRs were tested only on the right ear at a stimulus rate of 33.33 Hz. The ABR test was stopped when the recording reached the residual noise level of 0.04 µV. The ABRs amplitudes, absolute latencies, inter-peak latencies (IPLs), and the recorded number of averages were statistically compared among ABRs at different stimulus polarities and stimuli combinations.

Results

Rarefaction polarity had the largest ABR amplitudes and SNRs compared with other stimulus polarities in both stimuli. There were marginal differences in the absolute latencies and IPLs among stimulus polarities. No significant difference in the number of averages required to reach the stopping criteria was found.

Conclusions

Stimulus polarities have a significant influence on the ABR to LS chirp. Rarefaction polarity is recommended for clinical use because of its larger ABR peak I, III, and V amplitudes than those of the other stimulus polarities.

Introduction

Auditory Brainstem Response (ABR) is an objective test used to estimate hearing thresholds and to determine the site of disorder along the central auditory system. ABR was found in the 1970s and is often regarded as only representing high-frequency hearing. This is because the greatest neural synchrony was obtained only from the basal region of the cochlear that corresponds to the higher frequency stimulation. The neural synchrony obtained from the high frequency is attributed to the steep-onset of the click stimulus in eliciting neural synchrony responses at the basilar membrane that causing the cancellation of the non-dispersive low frequency components. To improve the neural synchrony of ABR by including neural responses from the low frequency fibers, Dau, et al. [1] constructed an upward chirp stimulus from a previously published work of Shore and Nuttall [2].
Responses from the entire basilar membrane were obtained by modification of the upward chirp stimulus on the stimulus presentation according to the distance along the basilar membrane for each frequency signal. The low frequency signal is tuned towards the apical regions and requires longer travelling time compared to the high frequency signal. Optimum neural synchrony was achieved by first presenting a chirp stimulus with low frequency signal that needs a longer travel time. The high frequency signal was presented later since it required a shorter travelling time with the aim of ensuring all frequencies arriving simultaneously at the basilar membrane. The first few publications on ABR elicited from the upward chirp stimulus suggested a promising finding on the increase in the ABR wave V amplitude than the ABR elicited from the click stimulus [1,3,4]. The upward chirp stimulus was later found to be ineffective in eliciting ABR especially at high intensity levels with a minimal improvement of waves V amplitudes and an absence of the earlier waves [5,6]. Following that, an intensity-dependent chirp was then later developed by Elberling, et al. [7] to solve this issue and is commonly known as level-specific (LS) chirp. In LS chirp, the stimulus duration is adjusted according to the intensity. High and low intensity level stimuli are presented with short and long duration, respectively. This adjustment is essential to minimize upward spread of excitation at the high intensity levels that can hamper the excitation of some fast neural fibers of the earlier ABR waves as reported in the previous studies [5,6]. Using LS chirp to elicit an ABR, several studies reported positive findings including larger V wave amplitude at lower or high intensity levels and the presence of ABR wave I and III with larger amplitude compared to the ABR of click stimulus [8-12].
LS chirp ABR has been investigated in various technical and recording factors including stimulus repetition rate [10], electrode montage [8,9], and duration of presentation [7]. One of the factors that can influence ABR recording is the stimulus polarity. Although all these factors have been explored, the stimulus polarities that could influence the ABR results elicited from LS chirp is still unknown. Stimulus polarity is crucial during the initial stimulus presentation because it will determine the way the sound pressure wave is presented. Besides that, it will determine the transferring of the sound to the external auditory canal, tympanic membrane, and the cochlear, specifically at the basilar membrane and hair cells. The stimulus polarity also will determine the physiological reaction of these structures. The three common stimulus polarity types used in the ABR include rarefaction, condensation, and alternating [13].
The influence of stimulus polarity has been thoroughly investigated for ABR elicited from click and tone burst stimuli [14-17]. There was no consensus on the findings related to the influence of polarity on the ABR elicited by either click or tone burst stimuli. Few studies reported a small or no difference in the click ABR latencies and amplitudes between the different stimulus polarities [15,16,18]. However, there were some studies that reported the presence of clinically significant differences but with mixed results [14,19,20]. Few studies reported that the ABR from rarefaction polarity has a larger ABR wave I, III, and V amplitude [14,15,19,21] while a study showed contradictory findings [20]. In addition, few studies reported shorter ABR latencies of either wave I, III, and V from rarefaction than the ABR from condensation stimulus [15,20,21]. Literature on the frequency specific of ABR using tone burst stimulus reported that the stimulus polarities were highly influenced by the respective stimulus frequencies. The ABR elicited from low frequency signal shows large differences in the latencies and amplitudes with stimulus polarities than the ABR elicited by high frequency signal [16,17,22,23]. Interestingly, similar findings were also observed when comparing the low frequency ABR with the ABR elicited to click stimulus since ABR to click is thought to only reflect the high frequency hearing due to the phase dispersion [16].
There is only one study reported the influence of stimulus polarity on the ABR via upward chirp stimulus [24]. This study investigated the influence of stimulus polarity on the ABR alongside other factors including stimulus rate, type of stimulus, frequency, and intensity levels in 168 neonates and 20 adults. The authors found no significant influence of stimulus polarities on the upward chirp ABR wave V latency and amplitudes. In addition, the neonatal participants showed no upward chirp ABR wave I and III from the alternating polarity compared to ABR to rarefaction and condensation polarity. The percentage of ABR wave I and III to be present in the ABR to upward chirp stimulus was higher from the ABR to condensation polarity in their neonatal subject. This is in-contrast to the higher percentage of ABR wave I and III to be present in the ABR rarefaction polarity in their adult subject. Few studies have reported the influence of stimulus polarity in the ABR to click or tone burst stimuli [14-17] and one study on the ABR to upward chirp stimulus [24], however, there was no study on the influence of ABR elicited from LS chirp stimulus. Hypothetically the influence of stimulus polarity could be different between the ABR elicited from the click and chirp stimuli in general and LS chirp specifically. One of the possible explanations is that the ABR to click stimulus is thought to be generated by high-frequency signals and as reported, the phase sensitive neurons were mostly generated by the low frequency signals [16]. The ABR elicited from the broadband chirp stimulus such as LS chirp consists of responses originating from the basilar membrane representing responses stem from a wider range of frequencies. Therefore, neurons that are sensitive to phase could be highly contributed to the ABR and probably different from the ABR elicited from the click stimulus. In addition, the influence of stimulus polarities between the traditional upward chirp and LS chirp stimuli could also be different because of the difference in stimulus presentation, especially at the high intensity levels. The duration of upward chirp stimulus is longer at the suprathreshold whereas the duration of LS chirp is brief to avoid the upward spread of excitation. Due to these differences in the upward chirp stimulus and LS chirp, the influence among stimulus polarities could also be different in the ABR generated by these two different stimuli. The lack of study investigating the influence of stimulus polarity on the ABR from LS chirp has initiated this study to evaluate the influence of stimulus polarities on the ABR from LS chirp compared to ABR from click stimulus in normal hearing adults.

Subjects and Methods

Selection of participants

This study received ethical approval from the Institutional Research Ethics Committee of International Islamic University Malaysia (IIUM) (approval code: IREC 2019-KAHS [U-01]). A total of 19 participants between 20 and 32 years old participated in this study. The participant met the study inclusion criteria of 1) no ear canal and tympanic membrane abnormalities, 2) normal hearing threshold bilaterally indicated by 20 dBHL or above at octave frequencies from 250 Hz to 8,000 Hz, 3) Type A tympanogram bilaterally suggesting normal middle ear function, 4) normal acoustic reflex thresholds, and 5) no history of otological problem.

Methods

The study was conducted in an electrophysiology room at Hearing & Speech Clinic, IIUM, Kuantan, Malaysia. The ABR signals were acquired via the Interacoustics Eclipse ABR system (Interacoustics, Middlefart, Denmark). The ABR was recorded using two-channels through ipsilateral and contralateral configurations. Result from the ipsilateral channel was used in the final analysis while the contralateral channel was used to confirm the location of wave V from the wave IV-V complex. Prior to the test, the participant’s skin was abraded and prepared using NuPrep skin preparation gel (Weaver and Company, Aurora, CO, USA) to minimize electrode resistance at four areas namely forehead, high forehead, and left and right mastoid. The prepared areas were placed with four Ambu Neuroline 720 electrodes (Ambu, Ballerup, Denmark). The non-inverting electrode and ground electrode were placed on the high forehead and lower forehead, respectively. The two inverting electrodes were placed on the right and left mastoid. The impedance level of each electrode was within 5 kΩ and the inter-electrode impedance was balanced to ensure optimum common mode rejection.
The ABR was elicited using a standard 0.1 ms click ABR and the commercially available LS chirp presented via Eclipse ER-3A insert phones (Interacoustics) at 80 dBnHL to the right ear. The ABR test was conducted separately for each of the stimulus polarity (rarefaction, condensation, and alternating). The stimulus presentation order (two stimuli and three polarities) was given randomly across study participants at a stimulus repetition rate of 33.33 Hz. The left ear was presented with 40 dBnHL off-set masking noise to prevent participation from the non-test cochlea. The subject was advised to be in the supine position on a bed and relaxed with eyes closed during the entire session to prevent physiological noise and muscle artefacts.
The ABR was averaged using Bayesian-weighted averaging until the residual noise level reached 0.04 μV to ensure reliable recording with a minimal amount of noise. The average ABR was then filtered using a 100-3,000 Hz band pass filter to remove any noise and unwanted activities. The artefact rejection level was set at 20 µV. Every ABR was recorded twice to ensure wave repeatability and only the data from the initial waveform were included in the final data analysis.

ABR analysis

The amplitudes of ABRs were determined from peak to the following trough while the absolute wave latencies were measured from 0 ms to the peak of respective waves I, III, and V and the inter-peak latencies (IPLs) I-III, III-V, and I-V were also obtained. The visual identification of waves I, III, and V was decided with an agreement by two observers, which are the first author and the second author. The number of averages from signal averaging processes to reach the residual noise at 0.04 µV was identified for each stimulus polarities and type of stimuli to determine the time savings provided by any of these combinations. In addition, the final signal-tonoise ratio (SNR) was computed for each recording by dividing the wave V amplitude after the signal averaging over the amount of residual noise. Only ABR waveforms with a minimum SNR 3:1 was accepted for further analysis.

Statistical analysis

The statistical analysis was conducted using Statistical Package for the Social Science version 20 (IBM Corp., Armonk, NY, USA). Friedman test was used to compare the mean differences between the ABRs recorded from two stimuli (click and LS chirp) and three stimulus polarities (rarefaction, condensation, and alternating) for the following variables, namely 1) ABR amplitudes wave I, III, and V; 2) absolute latencies of wave I, III, and V; 3) IPLs I-III, III-V, and I-V; 4) number of averages reaching the residual noise of 0.04 µV; and 5) the SNRs. A post-hoc analysis using Wilcoxon signed-rank test was then performed with multiple comparisons adjustments. The initial significance value of 0.05 was further divided by the six level of probabilities (3 polarities × 2 stimuli) resulting in the adjustment of the significance level to p=0.008. A non-parametric test was used since the data breached the parametric assumptions including the non-normal data distribution and in-homogeneous variance.

Results

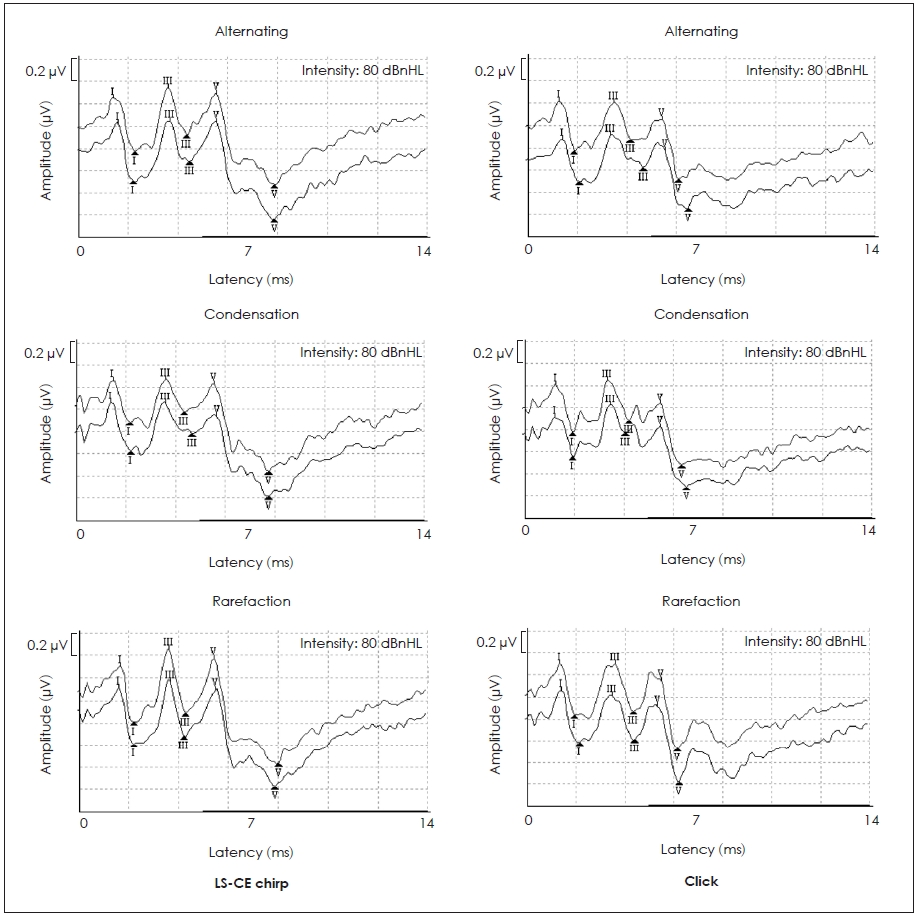
All participants’ ABRs were present at 80 dBnHL when elicited from both stimuli and stimulus polarities. ABRs wave I, III and V peaks were also identified in all study participants. Fig. 1 illustrates the ABR waveforms using two stimuli and three stimulus polarities from one of the study participants.

ABR amplitudes

The median and interquartile range (IQR) for the amplitudes of wave I, III, and V from click and LS chirp in rarefaction, condensation, and alternating polarities at 80 dBnHL are summarized in Table 1. The p-value for Wilcoxon signedrank post-hoc test for waves I, III, and V amplitudes are shown in Table 2. Friedman test showed a statistically significant difference in the mean of wave I, III, and V amplitudes among the ABRs obtained from the two stimuli and three stimulus polarities (χ2(5)=15.27-45.33, p<0.05).
The post-hoc analysis revealed that the largest wave I amplitude in each stimulus originating from the rarefaction polarity followed by the other two stimulus polarities (p<0.008). Comparisons between stimuli and polarities showed that the largest wave I amplitude were obtained from the ABR recorded using rarefaction polarity in both LS chirp and click stimuli (p<0.008).
For wave III, the ABR to rarefaction polarity shows the largest amplitudes in both stimuli although the results were only significant for the pair between the click ABR from rarefaction and alternating polarity (p<0.008). None of the pairs showed any statistical difference when comparing the ABR across stimuli and polarities except between click ABR rarefaction polarity and LS chirp ABR condensation polarity (p<0.008).
For wave V, the ABR to rarefaction polarity shows the largest amplitudes in both stimuli, however, the result was only significant in click ABR between rarefaction and alternating polarity (p<0.008). When comparing the ABR across stimuli and polarities, the largest wave V amplitude was obtained from the LS chirp ABR using rarefaction polarity. In addition, all the ABRs wave V amplitudes from LS chirp were significantly larger than the ABR to click regardless of the stimulus polarities (p<0.008). The only exception was the click ABR rarefaction polarity and the LS chirp ABR condensation polarity (p>0.008).

SNR

The median and IQR for the respective SNR of each ABR recordings are presented in Table 3. The p-value for the posthoc Wilcoxon signed-rank test for SNR for each ABR recording is shown in Table 4. Friedman test identified a statistically significant difference in the mean of SNRs among the ABRs obtained from the two stimuli and three stimulus polarities (χ2 (5)=44.47, p<0.001). Based on Tables 3 and 4, the SNR of the rarefaction polarity was the highest among the ABRs recorded from click stimulus (p<0.008) and there was no significant difference in any pairs of stimulus polarities among the ABRs to LS chirp stimulus (p>0.008). The rarefaction of LS chirp ABR has a significantly higher SNR compared to any of the click ABRs obtained from any stimulus polarities and the condensation of LS chirp ABR SNR was significantly higher only to the alternating clicks ABR (p<0.008). In addition, the alternating LS chirp SNR was significantly higher than the other click ABR stimulus polarities except for rarefaction click (p<0.008).

Absolute latencies

The median and IQR of absolute wave I, III, and V latencies from click and LS chirp in rarefaction, condensation, and alternating polarities at 80 dBnHL are summarized in Table 1. The p-value for the post-hoc Wilcoxon signed-rank test for waves I, III, and V latencies are shown in Table 5. Friedman test identified a statistically significant difference in the mean wave I and III latencies among the ABRs obtained from the two stimuli and three stimulus polarities (χ2(5)=24.98-36.01, p<0.001) but not for wave V (χ2(5)=0.18, p=0.180).
The post-host analysis revealed no significant differences in the absolute latencies of wave I and III in each click and LS chirp ABRs among the three stimulus polarities (p>0.008). The exception was for wave III latencies between condensation and alternating polarities in the ABR to LS chirp (p<0.008). Based on Table 1, the median LS chirp ABR condensation polarity wave III latencies were in fact similar with those from alternating polarity.
Several pairs with statistically significant differences were found when comparing the stimuli and polarities for wave I and III. The wave I absolute latencies of LS chirp ABR from rarefaction and alternating polarities were significantly longer than the click ABR from the same stimulus polarities (p<0.008). In addition, the wave I absolute latencies of LS chirp ABR from rarefaction polarity were significantly longer than the click ABR from alternating polarity (p<0.008). For wave III, the LS chirp ABR absolute latencies from condensation polarity were significantly longer than the click ABR of the same polarity (p<0.008). Moreover, the click ABR wave III absolute latencies from the alternating polarity were significantly longer than the LS chirp ABR from the same polarity (p<0.008). The LS chirp ABR from alternating polarity was significantly longer than the click ABR from condensation polarity (p<0.008).

IPLs

The median and IQR IPLs of I-III, III-V, and I-V for the ABR to click and LS chirp stimuli from the rarefaction, condensation, and alternating polarities are summarized in Table 1. The p-value for the post-hoc Wilcoxon signed-rank test for IPLs (IPL I-III, III-V, and I-V) comparisons are shown in Table 6. Friedman test identified a significant difference in the mean differences of IPLs (IPL I-III, III-V and I-V) among the ABRs obtained from the two stimuli and three stimulus polarities (χ2(5)=12.74-34.21, p<0.05).
For click ABR, the IPL I-III was only significantly longer in the rarefaction click ABR than the condensation clicks ABR but not from the other pairs as shown by the post-hoc Wilcoxon signed-rank test (p<0.008). There were no significant differences identified from any of the pairs from the LS chirp ABRs. When comparing the IPLs across stimuli and polarities, the IPLs I-III from the rarefaction and alternating click ABRs were significantly longer than the LS chirp at each same stimulus polarities (p<0.008). The click ABR IPLs I-III were also significantly longer than the LS chirp ABR in any combinations of the rarefaction and alternating polarities (p<0.008). No significant differences in the IPLs I-III were identified in any pair between the ABR from these stimuli using condensation stimulus polarity (p>0.008).
For IPL III-V, there were no pairs that showed significant differences in each of the click ABR and LS chirp ABRs as shown in Table 6 (p>0.008). Comparison between stimuli and polarities showed that none of the pairs among the ABRs IPL III-V from two stimuli and three stimulus polarities that were statistically different (p>0.008). Similar to IPL III-V, IPL I-V showed no pairs with significant differences in each of the click ABR and LS chirp ABRs as shown in Table 6 (p>0.008). When comparing across stimuli and polarities, similar finding from IPL I-III was obtained. The IPLs I-V from the rarefaction and alternating click ABRs were significantly longer than the LS chirp at each same stimulus polarities (p<0.008). The click ABR IPLs I-V were also significantly longer than the LS chirp ABR in any combinations of the rarefaction and alternating polarities (p<0.008). No significant differences were identified in any pair between the ABRs from the two stimuli using condensation stimulus polarity (p>0.008).

Number of averages

The median and IQR for the number of averages to reach a residual noise level of 0.04 μV is presented in Table 3. According to Friedman test analysis, there was no statistically significant difference identified in the number of averages for any combinations of the ABR recorded from two stimuli and three stimulus polarities (χ2(5)=4.58, p=0.47).

Discussion

The study aims to evaluate the influence of stimulus polarities on the ABR from LS chirp compared to ABR from click in normal hearing adults. In general, this study revealed that stimulus polarity influences the ABR findings with more effects were observed in the wave amplitudes than the absolute latencies.
Rarefaction polarity has the largest amplitude for all ABR peaks (I, III, and V) in both stimuli and has higher SNR than other stimulus polarities in the ABR to click stimulus. This finding is concurrent with several previous reports using ABR elicited from click stimulus [14,21]. To date, there was no consensus on the influence of stimulus polarities on the ABR findings. However, few studies reported no difference among stimulus polarities in the ABR to the click stimulus [16,18] and a similar finding was also reported in a single study conducted using rising chirp stimulus [24]. The discrepancy could be because of the interaction of other test parameters with polarities such as stimulus repetition rate, filtering, and artifact rejection that could be different across these studies. The enhancement of the ABR amplitudes for all peaks in both stimuli when using rarefaction polarity may be due to the low frequency neurons (also known as slow fibers) that is sensitive to the phase differences [21]. In particular, the low frequency neurons typically respond when the basilar membrane is moving towards scala vestibuli resulting in depolarization by the initiation from the rarefaction polarity [25].
This study also showed no influence of the stimulus polarities on the ABR absolute latencies in both stimuli. Similar to the ABR amplitudes, findings on the absolute latencies in this study is in line with few previous studies [15,16,18] and are not consistent with other studies [21,26]. Although some studies showed statistically significant differences in the absolute latencies between polarities, consideration should also be taken to determine the clinical significance of the differences. The clinically significant difference value was reported to be within 0.09 ms for ABR elicited to click stimulus [27] and 0.11 ms for ABR to LS chirp [28]. As suggested by Beattie [15], the differences in the absolute latencies between polarities were considered very small to be clinically significant and are consistent with the findings in this study. Similar to the absolute latencies, there was a minimal influence of stimulus polarities in each of the ABR to click and LS chirp stimulus for all IPLs. To the best of our knowledge, only de Lima, et al. [26] investigated the influence of stimulus polarities for IPLs in the ABR to click stimulus whereby the author found significant differences among stimulus polarities for IPL III-V and I-V. However, the differences noted in the study were small and within the normal test-retest reliability values for IPLs [27].
Comparing wave V amplitudes across stimulus and polarities, a noticeable finding was the larger wave V amplitude and SNR in the ABR to LS chirp than to the click stimulus regardless of the stimulus polarities. This finding is consistent with several studies that reported an enhancement of wave V amplitude when using LS chirps due to the improvement in neural synchrony from the time-frequency adjustment approach [9-11]. However, the results in this study are not consistent with the two earlier reports that found larger ABR wave I and III amplitude from the LS chirp stimulus than the click stimulus [9,10]. There was no possible explanation that could be proposed, however, future studies are needed to collect more evidence to unravel this finding.
In general, the absolute latencies for wave I and III were also longer in ABR to LS chirp than the ABR to click [9,10]. Similar findings were also reported in other studies [9,10]. The maximum median differences in the absolute latencies wave I and III between ABRs elicited from click and LS chirp stimuli were 0.13 ms and only slightly higher than the 0.11 ms value of test-retest reliability of ABR wave I and III latencies. There is no clear explanation for the longer absolute latencies when eliciting an ABR from LS chirp than the click stimulus. This finding suggests there is a slight delay in exciting the lower brainstem auditory neurons (neural generators for wave I and III) when using the LS chirp that resulted in a delay of the ABR wave I and III absolute latencies compared to click stimulus.
There were no time savings obtained from the ABR using rarefaction polarity based on the termination criterion to stop the recording when the residual noise approached 0.04 µV. This is despite the larger wave V amplitude and SNR of the ABR from rarefaction polarity over other stimulus polarities. This implies that none of the stimulus polarity could provide benefit in terms of the ABR test time. One of the proposed explanations on the lack of differences among the stimulus polarities in providing time savings is the use of residual noise as stopping criteria instead of SNR. This is explained by Dzulkarnain, et al. [10] in which stopping based on a specified residual noise level could not make any difference if the recorded background noise is the same among the experimental variables. Stopping based on specified SNR may have the possibility to increase the likelihood to detect any differences among experimental variables particularly when there are large differences in the ratio of the ABR amplitude and noise.
The results in this study are limited to the study participants, equipment, stimulus, and the use of recording parameters. Future studies could potentially investigate the effects of stimulus polarity to the ABR elicited from LS chirp in children and explore the same effects in the frequency-specific stimulus such as narrow band LS chirp. As highlighted in the introduction of this paper, the ABRs obtained from the low frequency could potentially show significant effects of stimulus polarities compared to the broadband stimulus since low frequency neurons are more sensitivities towards phase [16].
This study concluded that the stimulus polarities have a significant influence on the ABR to LS chirp results, however, the obvious influence can only be found in the ABR waves amplitudes and SNR. There was a marginal difference in the ABRs to the LS chirp absolute latencies and IPLs from various stimulus polarities and no time-savings can be observed in any stimulus polarities using residual noise level as a stopping criterion. Overall, rarefaction polarity is recommended for clinical application when eliciting ABRs using either click or LS chirp stimuli because of the larger ABR peak I, III, and V amplitudes with higher SNR.

Acknowledgments

The authors wish to acknowledge the Transdisciplinary Research Grant Scheme (TRGS/1/2019/UIAM/02/4/2) from Ministry of Higher Education of Malaysia, for their financial support in conducting this study.

Notes

Conflicts of interest

The authors have no financial conflicts of interest.

Author Contributions

Conceptualization: Ahmad Aidil Arafat Dzulkarnain. Data curation: Sabrina Salamat, Fatin Nabilah Jamal, Ahmad Aidil Arafat Dzulkarnain, Fatin Amira Shahrudin. Formal analysis: Sabrina Salamat, Ahmad Aidil Arafat Dzulkarnain. Funding acquisition: Ahmad Aidil Arafat Dzulkarnain. Investigation: Sabrina Salamat, Ahmad Aidil Arafat Dzulkarnain, Fatin Amira Shahrudin, Mohd Normani Zakaria. Methodology: Sabrina Salamat, Ahmad Aidil Arafat Dzulkarnain. Project administration: Ahmad Aidil Arafat Dzulkarnain, Mohd Normani Zakaria. Resources: Sabrina Salamat, Ahmad Aidil Arafat Dzulkarnain, Fatin Amira Shahrudin. Supervision: Ahmad Aidil Arafat Dzulkarnain, Mohd Normani Zakaria. Validation: Ahmad Aidil Arafat Dzulkarnain. Visualization: Ahmad Aidil Arafat Dzulkarnain, Fatin Nabilah Jamal. Writing—original draft: Sabrina Salamat. Writing—review & editing: Ahmad Aidil Arafat Dzulkarnain. Approval of final manuscript: all authors.

Fig. 1.
ABR waveforms using LS chirp (left) and click (right) stimuli in three stimulus polarities from one study participant.
jao-2021-00248f1.jpg
Table 1.
The absolute latencies, amplitudes, and IPLs for all respective waves of Auditory Brainstem Responses in three stimulus polarities at 80 dBnHL for two stimuli
Click
LS chirp
Rarefaction Condensation Alternating Rarefaction Condensation Alternating
Latency (ms)
 Wave I 1.27 (0.20) 1.27 (0.20) 1.27 (0.20) 1.40 (0.33) 1.40 (0.14) 1.40 (0.20)
 Wave III 3.53 (0.13) 3.40 (0.20) 3.57 (0.13) 3.47 (0.27) 3.53 (0.26) 3.53 (0.27)
 Wave V 5.20 (0.20) 5.27 (0.27) 5.27 (0.13) 5.27 (0.20) 5.27 (0.27) 5.27 (0.20)
Amplitude (µV)
 Wave I 0.45 (0.20) 0.27 (0.14) 0.34 (0.13) 0.40 (0.14) 0.35 (0.16) 0.34 (0.11)
 Wave III 0.46 (0.14) 0.39 (0.28) 0.35 (0.14) 0.42 (0.20) 0.35 (0.21) 0.37 (0.12)
 Wave V 0.68 (0.20) 0.59 (0.18) 0.64 (0.23) 0.93 (0.16) 0.80 (0.24) 0.87 (0.18)
IPL (ms)
 Wave I-III 2.27 (0.13) 2.13 (0.26) 2.27 (0.20) 2.07 (0.20) 2.20 (0.20) 2.07 (0.06)
 Wave III-V 1.80 (0.20) 1.87 (0.20) 1.80 (0.14) 1.80 (0.14) 1.73 (0.13) 1.80 (0.20)
 Wave I-V 4.13 (0.27) 3.93 (0.33) 4.00 (0.20) 3.87 (0.27) 4.00 (0.20) 3.87 (0.20)

Data are presented as a median (interquartile range). IPL, inter-peak latency; LS, level-specific

Table 2.
The post-hoc analysis for the amplitudes of Auditory Brainstem Response waves I, III, and V using Wilcoxon signed-rank test
Stimulus Wave Polarity Click
LS chirp
Rarefaction Condensation Alternating Rarefaction Condensation Alternating
Click Wave I Rarefaction 0.002* <0.001* 0.825 0.002* 0.014
Condensation 0.002* 0.08 <0.001* 0.061 0.004*
Alternating <0.001* 0.080 <0.001* 0.533 0.013
Wave III Rarefaction 0.022 0.001* 0.445 0.008* 0.046
Condensation 0.022 0.324 0.014 0.687 0.747
Alternating 0.001* 0.324 0.045 0.747 0.687
Wave V Rarefaction 0.014 0.001* 0.003* 0.077 0.005*
Condensation 0.014 0.952 <0.001* 0.001* 0.001*
Alternating 0.001* 0.952 <0.001* 0.002* 0.001*
LS chirp Wave I Rarefaction 0.004* 0.005*
Condensation 0.004* 0.344
Alternating 0.005* 0.344
Wave III Rarefaction 0.077 0.010
Condensation 0.077 0.687
Alternating 0.010 0.687
Wave V Rarefaction 0.070 0.533
Condensation 0.070 0.044
Alternating 0.533 0.044

Data are p-values.

* Indicate significant p-value (p<0.008).

LS, level-specific

Table 3.
SNR and number of averages to reach residual noise level of 0.04 μV in the Auditory Brainstem Responses elicited from two stimuli and three stimulus polarities
Stimulus Polarity SNR Number of averages
Click Rarefaction 16.9 (5.50) 3,400 (6,900)
Condensation 12.7 (9.10) 1,900 (5,500)
Alternating 13.9 (6.30) 3,300 (5,200)
LS chirp Rarefaction 20.8 (7.40) 2,100 (4,400)
Condensation 16.6 (4.70) 3,200 (4,800)
Alternating 18.4 (5.00) 2,000 (5,000)

Data are presented as a median (interquartile range). SNR: signal-to-noise ratio, LS: level-specific

Table 4.
The post-hoc analysis of the signal-to-noise ratio of each Auditory Brainstem Response recording using Wilcoxon signed-rank test
Stimulus Polarity Click
LS chirp
Rarefaction Condensation Alternating Rarefaction Condensation Alternating
Click Rarefaction 0.001* 0.006* 0.011 0.695* 0.198
Condensation 0.001* 0.049 <0.001* 0.001* 0.001*
Alternating 0.006* 0.049 <0.001* 0.017 0.001*
LS chirp Rarefaction 0.049 0.058
Condensation 0.049 0.177
Alternating 0.058 0.177

Data are p-values.

* Indicate significant p-value (p<0.008).

LS, level-specific

Table 5.
The post-hoc analysis of the latencies of each Auditory Brainstem Response wave using Wilcoxon signed-rank test
Stimulus Wave Polarity Click
LS chirp
Rarefaction Condensation Alternating Rarefaction Condensation Alternating
Click Wave I Rarefaction 0.163 0.546 0.001* 0.161 0.002*
Condensation 0.163 0.074 0.161 0.381 0.009
Alternating 0.546 0.074 <0.001* 0.009 <0.001*
Wave III Rarefaction 0.029 0.064 0.109 0.156 0.507
Condensation 0.029 0.030 0.156 0.005* 0.007*
Alternating 0.064 0.030 0.507 0.007* 0.007*
LS chirp Wave I Rarefaction 0.525 0.797
Condensation 0.525 0.678
Alternating 0.797 0.678
Wave III Rarefaction 0.021 0.371
Condensation 0.021 0.007*
Alternating 0.371 0.007*

Data are p-values.

* Indicate significant p-value (p<0.008).

LS, level-specific

Table 6.
The post-hoc analysis of the IPLs of each Auditory Brainstem Response wave using Wilcoxon signed-rank test
Stimulus Wave Polarity Click Polarity
LS chirp
Rarefaction Condensation Alternating Rarefaction Condensation Alternating
Click IPL I-III Rarefaction 0.004* 0.023 <0.001* 0.108 <0.001*
Condensation 0.004* 0.029 0.348 0.075 0.602
Alternating 0.023 0.029 0.003* 0.855 0.002*
IPL III-V Rarefaction 0.061 0.252 0.977 0.737 0.774
Condensation 0.061 0.042 0.018 0.024 0.026
Alternating 0.252 0.042 0.875 0.323 0.975
IPL I-V Rarefaction 0.407 0.608 <0.001* 0.106 0.001*
Condensation 0.407 0.378 0.098 0.913 0.147
Alternating 0.608 0.378 0.004* 0.264 0.005*
LS chirp IPL I-III Rarefaction 0.013 0.169
Condensation 0.013 0.030
Alternating 0.169 0.030
IPL III-V Rarefaction 0.657 0.954
Condensation 0.657 0.165
Alternating 0.954 0.165
IPL I-V Rarefaction 0.052 0.515
Condensation 0.052 0.078
Alternating 0.515 0.078

Data are p-values.

* Indicate significant p-value (p<0.008).

IPL, inter-peak latency; LS, level-specific

REFERENCES

1. Dau T, Wegner O, Mellert V, Kollmeier B. Auditory brainstem responses with optimized chirp signals compensating basilar-membrane dispersion. J Acoust Soc Am 2000;107:1530–40.
crossref pmid
2. Shore SE, Nuttall AL. High-synchrony cochlear compound action potentials evoked by rising frequency-swept tone bursts. J Acoust Soc Am 1985;78:1286–95.
crossref pmid
3. Riedel H, Kollmeier B. Comparison of binaural auditory brainstem responses and the binaural difference potential evoked by chirps and clicks. Hear Res 2002;169:85–96.
crossref pmid
4. Fobel O, Dau T. Searching for the optimal stimulus eliciting auditory brainstem responses in humans. J Acoust Soc Am 2004;116:2213–22.
crossref pmid
5. Ivo Rodrigues GR, Ruthi Lewis D. Comparison of click and CE-chirp® stimuli on brainstem auditory evoked potential recording. Rev Soc Bras Fonoaudiol 2012;17:412–6.
crossref
6. Petoe MA, Bradley AP, Wilson WJ. On chirp stimuli and neural synchrony in the suprathreshold auditory brainstem response. J Acoust Soc Am 2010;128:235–46.
crossref pmid
7. Elberling C, Callø J, Don M. Evaluating auditory brainstem responses to different chirp stimuli at three levels of stimulation. J Acoust Soc Am 2010;128:215–23.
crossref pmid pmc
8. Dzulkarnain AAA, Abdullah SA, Ruzai MAM, Ibrahim SHMN, Anuar NFA, Rahim AEA. Effects of different electrode configurations on the narrow band level-specific CE-Chirp and tone-burst auditory brainstem response at multiple intensity levels and frequencies in subjects with normal hearing. Am J Audiol 2018;27:294–305.
crossref pmid
9. Dzulkarnain AAA, Noor Ibrahim SHM, Anuar NFA, Abdullah SA, Tengku Zam Zam TZH, Rahmat S, et al. Influence of two-electrode montages on the level-specific (LS) CE-Chirp auditory brainstem response (ABR) at multiple intensity levels. Int J Audiol 2017;56:723–32.
crossref pmid
10. Dzulkarnain AAA, Shahrudin FA, Jamal FN, Marzuki MN, Mazlan MNS. Effects of stimulus repetition rates on the auditory brainstem response to level-specific CE-Chirp in normal-hearing adults. Am J Audiol 2020;29:838–50.
crossref pmid
11. Kristensen SG, Elberling C. Auditory brainstem responses to levelspecific chirps in normal-hearing adults. J Am Acad Audiol 2012;23:712–21.
crossref pmid
12. Cargnelutti M, Cóser PL, Biaggio EPV. LS CE-Chirp® vs. click in the neuroaudiological diagnosis by ABR. Braz J Otorhinolaryngol 2017;83:313–7.
crossref pmid
13. Hall JW III. eHandbook of auditory evoked responses: principles, procedures & protocols. Seattle: Kindle Direct Publishing;2015.

14. Sand T. The choice of ABR click polarity and amplitude variables in multiple sclerosis patients. Scand Audiol 1991;20:75–80.
crossref pmid
15. Beattie RC. Interaction of click polarity, stimulus level, and repetition rate on the auditory brainstem response. Scand Audiol 1988;17:99–109.
crossref pmid
16. Fowler CG. Effects of stimulus phase on the normal auditory brainstem response. J Speech Hear Res 1992;35:167–74.
crossref pmid
17. Gorga MP, Kaminski JR, Beauchaine KL. Effects of stimulus phase on the latency of the auditory brainstem response. J Am Acad Audiol 1991;2:1–6.
pmid
18. Ballachanda BB, Moushegian G, Stillman RD. Adaptation of the auditory brainstem response: effects of click intensity, polarity, and position. J Am Acad Audiol 1992;3:275–82.
pmid
19. Rawool VW. Effects of click polarity on the auditory brainstem responses of older men. Audiology 1998;37:100–8.
crossref pmid
20. Pratt H, Bleich N. Effects of click polarity on auditory brain-stem potentials: a three-channel Lissajous’ trajectory study. Hear Res 1989;42:119–27.
crossref pmid
21. Schwartz DM, Morris MD, Spydell JD, Ten Brink C, Grim MA, Schwartz JA. Influence of click polarity on the brain-stem auditory evoked response (BAER) revisited. Electroencephalogr Clin Neurophysiol 1990;77:445–57.
crossref pmid
22. Parthasarathy TK, Borgsmiller P, Cohlan B. Effects of repetition rate, phase, and frequency on the auditory brainstem response in neonates and adults. J Am Acad Audiol 1998;9:134–40.
pmid
23. Orlando MS, Folsom RC. The effects of reversing the polarity of frequency-limited single-cycle stimuli on the human auditory brain stem response. Ear Hear 1995;16:311–20.
crossref pmid
24. Cobb KM, Stuart A. Neonate auditory brainstem responses to CE-chirp and CE-chirp octave band stimuli II: versus adult auditory brainstem responses. Ear Hear 2016;37:724–43.
crossref pmid
25. Møller AR. Effect of click spectrum and polarity on round window N1N2 response in the rat. Audiology 1986;25:29–43.
crossref pmid
26. de Lima JP, de Freitas Alvarenga K, Foelkel TP, Monteiro CZ, Agostinho RS. Polarity stimulation effects on brainstem auditory evoked potentials. Braz J Otorhinolaryngol 2008;74:725–30.
crossref pmid
27. Dzulkarnain AAA, Buyong AS, Sulaiman NH. Intra-subject variability in the auditory brainstem response using a vertical montage recording. Speech, Language and Hearing 2014;17:160–7.
crossref
28. Jamal FN, Arafat Dzulkarnain AA, Shahrudin FA, Marzuki MN. Test-retest reliability of level-specific CE-Chirp auditory brainstem response in normal-hearing adults. J Audiol Otol 2021;25:14–21.
crossref pmid


ABOUT
ARTICLES

Browse all articles >

ISSUES
TOPICS

Browse all articles >

AUTHOR INFORMATION
Editorial Office
The Catholic University of Korea, Institute of Biomedical Industry, 4017
222, Banpo-daero, Seocho-gu, Seoul, Republic of Korea
Tel: +82-2-3784-8551    Fax: +82-0505-115-8551    E-mail: jao@smileml.com                

Copyright © 2024 by The Korean Audiological Society and Korean Otological Society. All rights reserved.

Developed in M2PI

Close layer
prev next