Efficacy of the Digit-in-Noise Test: A Systematic Review and Meta-Analysis
Article information

Abstract
Background and Objectives
Although the digit-in-noise (DIN) test is simple and quick, little is known about its key factors. This study explored the considerable components of the DIN test through a systematic review and meta-analysis.
Materials and Methods
After six electronic journal databases were screened, 14 studies were selected. For the meta-analysis, standardized mean difference was used to calculate effect sizes and 95% confidence intervals.
Results
The overall result of the meta-analysis showed an effect size of 2.224. In a subgroup analysis, the patient’s hearing status was found to have the highest effect size, meaning that the DIN test was significantly sensitive to screen for hearing loss. In terms of the length of the presenting digits, triple digits had lower speech recognition thresholds (SRTs) than single or pairs of digits. Among the types of background noise, speech-spectrum noise provided lower SRTs than multi-talker babbling. Regarding language variance, the DIN test showed better performance in the patient’s native language(s) than in other languages.
Conclusions
When uniformly developed and well validated, the DIN test can be a universal tool for hearing screening.
Introduction
Early screening of hearing loss is essential for all people with any experience of noise exposure or aging. In other words, a hearing test is the first step in the treatment of hearing loss [1]. Although a simple hearing test using pure tones has been developed and used [2], it is limited when identifying hearing problems in daily life because the test is usually conducted in an artificially quiet environment, not in a naturally noisy one. Moreover, a major complaint of people with hearing loss is that they can hear the speech, but do not understand it, especially in the presence of background noise [3]. Thus, testing the speech perception of people who are suspected of having a hearing loss should take place under noisy conditions.
As an alternative, many researchers have adopted the speechin-noise test that uses simple digits, called the digit-in-noise (DIN) test [3-17]. The DIN test can easily and reliably (self-) screen that a patient has hearing loss by using a simple presentation method with a single digit (e.g., 0, 1, 2) and/or a series of digits (e.g., 3-6-1). Unlike other elements of speech, such as syllables, words, and sentences, the DIN test is rarely affected by a patient’s auditory and cognitive ability [7,10]. As a result, the DIN test could be administered to even non-native speakers of a language [11]. Based on these advantages, the DIN test is suitable for hearing screening test to early detection of hearing loss and fitting of hearing assistive devices such as hearing aid and cochlear implant [7,12].
The DIN that has been developed by many researchers since 2000 is now available in Dutch, US English, UK English, Persian, Polish, Australian English, Canadian English and Canadian French, South African English, Flemish, French, Greek, German, Swedish, Swiss, Italian, Mandarin, Russian, and Spanish (Supplementary Fig. 1 in the online-only Data Supplement). It can also be used on telephones, smartphones and tablets in convenience. Also, the DIN test currently used as the hearing screening tool especially for the Netherland and South Africa [7,10]. Nevertheless, there are discrepancies in the contents and testing methods due to different perspectives among the researchers who developed the DIN. In this light, using systematic review and meta-analysis, this study examines the major factors to consider when developing and administering the DIN test: the patient’s hearing status, types of stimuli and noise, language comparisons, and the patient’s language competency.
Materials and Methods
Search strategy
All the processes, containing inclusion criteria, article search strategy, and article selection were followed by a Preferred Reporting Items for Systematic Reviews and Meta-analysis (PRISMA) statement [18] and the International Prospective Register of Systematic Reviews (PROSPERO) of Cochrane Collaboration [19], both of which have been used for a systematic search and meta-analysis of the published articles.
The precise definition of inclusion and/or exclusion criteria is necessary to identify the homogeneity and reliability of the eligible studies. For the inclusion criteria of articles for this systematic review and meta-analysis, a strategy of participants, intervention, control, outcome measures, and study design (PICOS) was applied [18]. Table 1 displays the PICOS criteria used in this study. Animal studies, data papers, general articles (e.g., narrative reviews, conference abstracts, letters, books and book chapters, magazines, and conference proceedings), and articles not written in English were excluded.
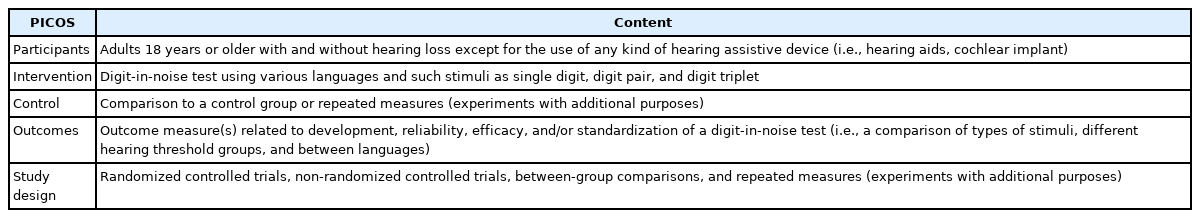
Inclusion criteria for the current study based on participants, intervention, control, outcomes, and study designs (PICOS)
Article selection
Six electronic journal databases—Embase, MEDLINE, PubMed, Web of Science, Science Direct, and Cumulative Index to Nursing and Allied Health—were used to search for the articles. Miller, et al. [20] had used digits as test material to identify any context effect for speech intelligibility and compared those materials to words or syllables. Since then, as an alternative material for speech and/or hearing screening, digits have been used in more recent studies [3-16]. Thus, all authors discussed the time frame of the article search and selection as January 1951 to December 2020. The key terms were “digit-in-noise test” AND “single digit” OR” digit pair” OR “digit triplet” AND “hearing screening test” AND “language” AND “background noise” AND “hearing loss” OR “normal hearing.” These terms were combined to minimize the need to filter out duplicate papers.
Fig. 1 depicts each step of the systematic article search and selection process. A total of 51,796 records were searched using six electronic journal databases. After eliminating 4,192 duplicates, 47,604 records remained. The titles and abstracts of 47,604 records were screened, resulting in the exclusion of 32,251 records. Then, the full texts of the remaining 15,353 records were reviewed at the eligibility stage. Finally, only 14 records met the PICOS criteria for this study, and they were included in the systematic review and meta-analysis.
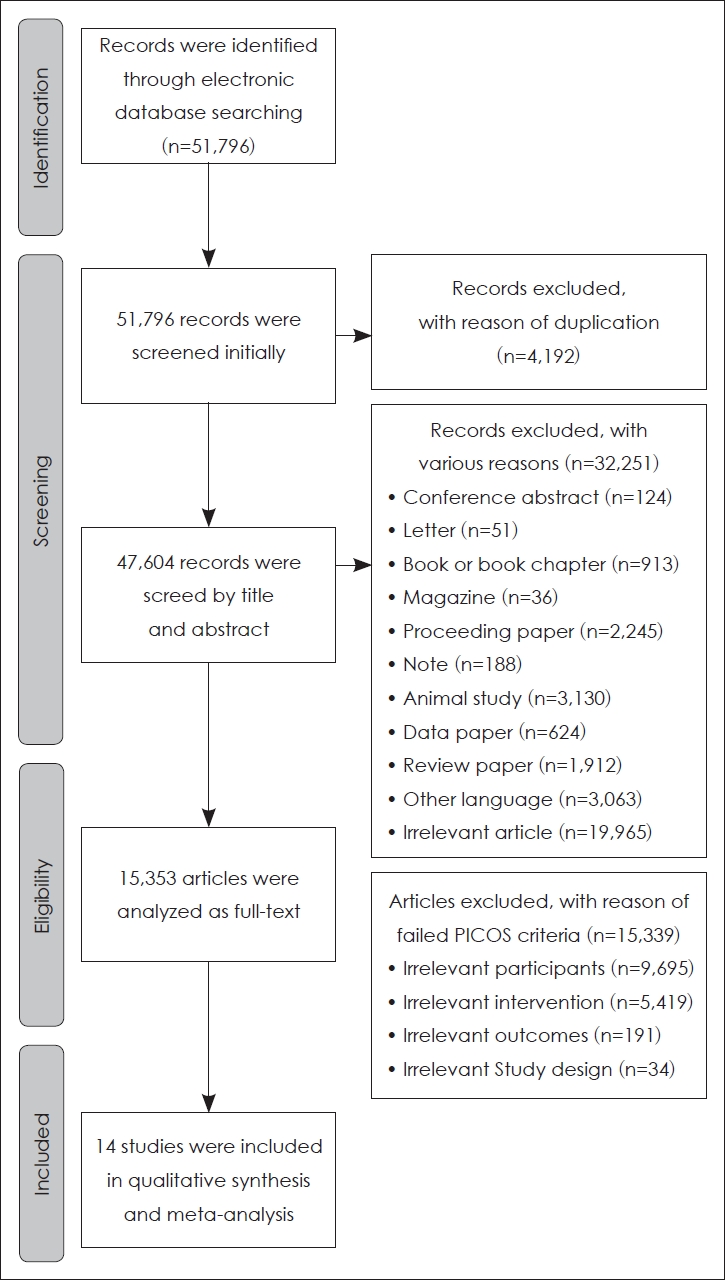
Preferred Reporting Items for Systematic Reviews and Meta-analysis (PRISMA) flow diagram that visually expresses the inclusion and exclusion process of the current study. PICOS, participants, intervention, control, outcome measures, and study design.
Study quality and potential sources of study bias
To evaluate both the study quality and any potential sources of study bias, we used the 11-item Physiotherapy Evidence Database (PEDro) Scale [21]. The scale assesses the quality of eligibility criteria, randomization and concealment of subjects, baseline of intervention, blinding of subjects and therapists, and key outcomes (Table 2). Each item was assigned 1 for “yes” or 0 for “no.” After evaluating the items, the quality of each study was ranked as “excellent” (9 to 11), “good” (6 to 8), “fair” (4 to 5), and “poor” (below 4). The findings of the highest-scoring studies were considered the most valid [22]. All authors conducted the study quality and potential sources of study bias process independently.

Analysis using the scientific study validity criteria based on PEDro checklists
The data contained in the articles were independently extracted and synthesized into six categories by the authors: 1) participants (number, age, and hearing threshold); 2) intervention (types of stimuli and noise, test condition, and language); 3) control group; 4) outcome measures; 5) study design; and 6) main findings.
Meta-analysis
The Comprehensive Meta-Analysis software (Ver. 3, Biostat Inc., Englewood, NJ, USA) was used for the meta-analysis. Fourteen articles were reviewed to determine whether their data were suitable, while utilizing the descriptive statistics (mean and standard deviation values in the experimental and control groups). Because the characteristics of the qualitatively synthesized data from the included articles were continuous and the types of outcome measures were different, standardized mean differences (SMDs) were used to calculate the effect sizes for each study. After calculating these effect sizes, a summary estimate was examined. The random-effect model was chosen to calculate both effect size and summary estimate. The funnel plot and Egger’s regression test were used to identify publication bias.
The Higgins I2-statistics and Cochran’s Q-test were used to confirm heterogeneity across the articles. The I2 values were expressed as the percentage from 0 to 100. For example, the interval ranges from 0 to 25%, 25% to 75%, and 75% to 100% of I2 value were considered as low, middle, and high heterogeneity, respectively [23]. The Q values for the Cochran test indicated a total variance across the dataset of the articles. This test showed statistical significance at 95% of confidence interval (CI), and heterogeneity across the dataset of articles.
However, since the articles were categorized based on outcome measures, subgroup analysis was conducted to compare the hearing condition, types of stimuli, types of noise, and a subject’s language competence. A meta-regression was applied based on three remarkable features (sound attenuation, sound localization, and speech perception) because of the possibility of high heterogeneity and/or different outcome measures for the subgroup analysis.
Results
Evaluation of study quality
The study quality calculated by the PEDro checklist showed a mean score of 6.64 (standard deviation [SD]: 1.15, range: 4-8 scores). Twelve of the 14 studies were ranked as “good,” with total values of 6 to 8 [3-4,6-8,10-16]. The remaining two studies [5,9] were evaluated as “fair,” with scores between 4 and 5.
Participants
The PICOS criteria of the reviewed articles are summarized in Table 3. In most of the articles, participants consisted either of adults with normal hearing [3,7,9,12-13,15] or adults with hearing loss [3-6,14,16]. Potgieter, et al.’s [10] study tested adults with both normal hearing and hearing loss. Interestingly, the studies by Jansen, et al. [8] and Smits, et al. [11] described their participants as “ears.” After recruiting the participants, their left and right ears were rated in terms of hearing thresholds (i.e., normal hearing and hearing loss).
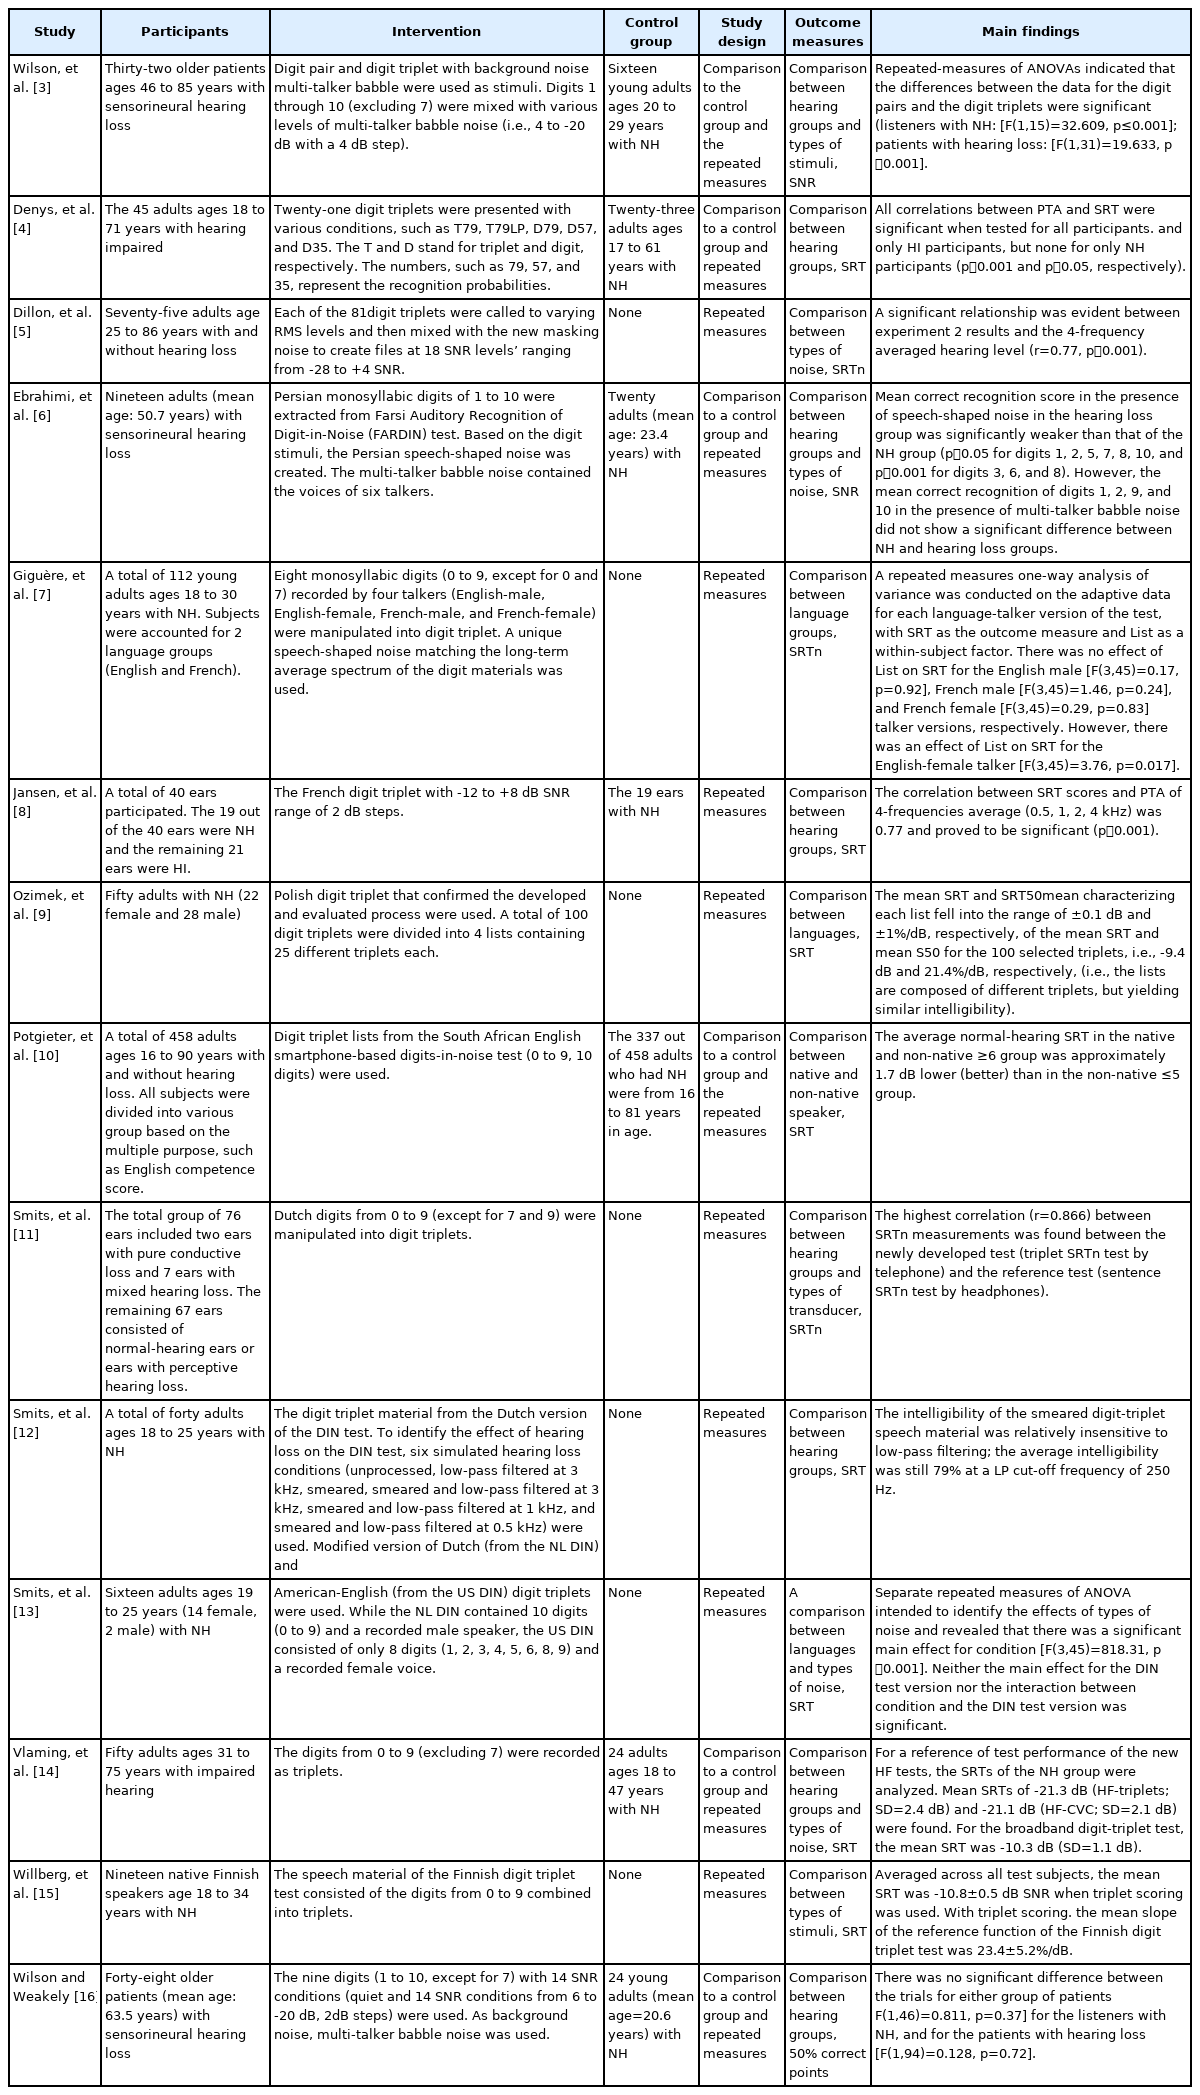
Characteristics and main findings for all enrolled studies for the participants, the intervention, control group, and the outcome of each study
Most of the studies concentrated on young adults [7,9,12-13,15], old adults [3,14,16], middle-aged adults [6], both young and middle-aged adults [8], and both young and old adults [4-5,10]. Unfortunately, the study conducted by Smits, et al. [11] did not mention the age of the “ears.”
Intervention
The types of digits used for testing were analyzed as the intervention. Although most studies used triple digits as their stimuli, their composition differed slightly. For example, of the nine studies that used 10 digits from 0 to 9, five applied all 10 digits [9-10,12-13,15], and four studies used all digits except for 7 [5,14], 7 and 9 [11], and 0, 7, and 9 digits [4].
Three articles selected the digits 1 to 10 instead of 0 to 9. Ebrahimi, et al. [6] used 1 to 10; while Wilson, et al. [3] and Wilson and Weakely [16] used 1 to 10, but excluded 7. The remaining two articles used either 1 to 9, again with the exception of 7 [7] or without exception [8].
Controls
Of the 14 articles, half had a control group of adults with normal hearing. This group comprised young adults [3,5,9], young and middle-aged adults [16], and young and old adults [4,7]. However, Jansen et al.’s [8] control group mentioned only the total number of ears. The remaining seven articles conducted repeated measures with an additional purpose [6,10-15].
Outcomes
The reviewed studies were classified into three outcome measures. Although the outcomes reported in all articles were consistent in their speech recognition thresholds (SRTs), the expressions were slightly different: SRT [4,8-10,12-15], SRTn which uses SRT with a digit [5,7,11], signal-to-noise ratio (SNR) [3,6], and the point where a subject hit 50% correct scores [16].
Study design
Five of the studies used between-group comparisons [3,4,10,14,16]. All 14 studies provided repeated measures.
Overall results in meta-analysis
The results of effect size for the studies using the random-effect model are presented in Fig. 2A. To consider the characteristics of the dataset, the data with mean and SD was collected for using the SMDs methods.

Forest plot (A) and funnel plot (B) of the 14 reviewed studies analyzed using standardized mean differences.
The studies resulted in SMDs of 2.224 (95% CI: 1.371-3.077, p<0.001). The funnel plotting is displayed in Fig. 2B. Based on the results of Egger’s regression analysis, the results of the meta-analysis showed no publication bias (Intercept: 8.77, 95% CI: 5.390-12.154, p<0.001). The Higgins I2-statistics and Cochran’s Q-test showed that heterogeneity was high (I2 : 96.83%, Q: 63.012, p<0.001).
To identify the results of the meta-analysis more clearly, a subgroup analysis was conducted based on hearing status, types of noise and stimulus, and language comparison.
Subgroup analysis
Fig. 3 depicts the results of the subgroup analysis. The first subgroup was divided into two groups with or without hearing loss (Fig. 3A), resulting in the highest effect size of 3.754 (95% CI: 2.840-4.669). It confirmed that the SRT of individuals with normal hearing was lower (or better) than that of the adults with hearing loss and/or hearing loss simulated by using the frequency filters.
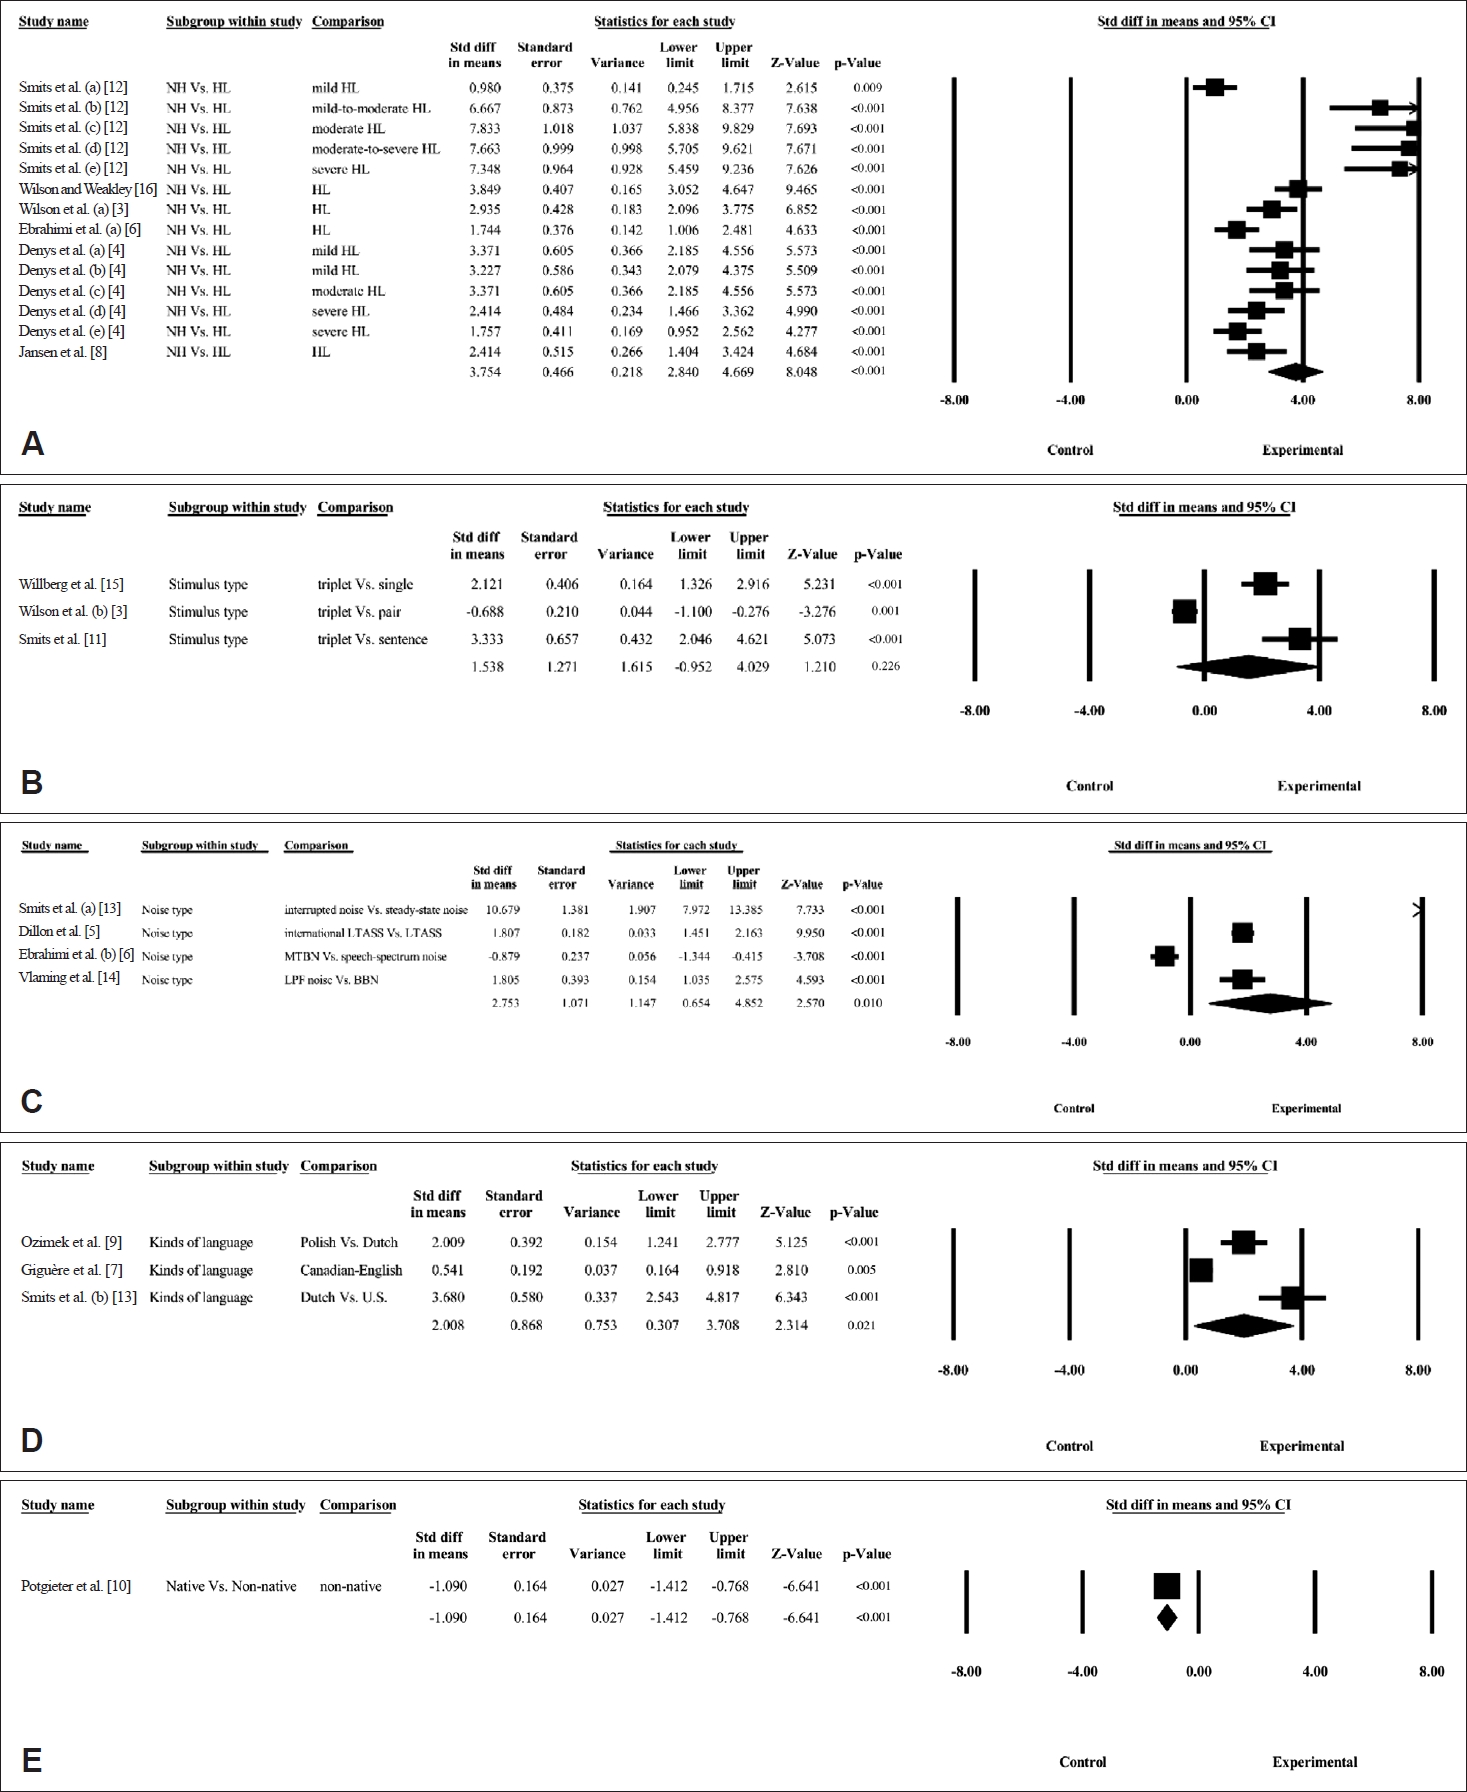
The forest plot for the subgroup analysis by hearing condition (A), types of stimulus (B) and noise (C), kinds of language (D), and language competence (E).
For stimulus types, the subgroup analysis consisted of studies that reported on the comparison between stimuli, such as single digits, paired digits, triple digits, and a sentence (Fig. 3B). Triple digits showed lower SRTs (the negative value of 50% SRT means a better noise threshold) compared to a single digit or sentence (effect size: 1.538, 95% CI: -0.952-4.029). In Fig. 3C, the noise type subgroup showed the effect size of 2.753 (95% CI: 0.654-4.852), indicating that speech-spectrum noise provided lower SRT than did the condition of multi-talker babble noise.
As the language variance was compared for the different languages, the effect size showed 2.008 (95% CI: 0.307-3.708) (Fig. 3D). This result demonstrated that the DIN test with subject’s own language had a significantly lower SRT than the DIN test with previously developed or applied to a more frequently used language such as English. However, the comparison between native and non-native speakers resulted in an effect size of -1.090 (95% CI: -1.412--0.768) for the SMDs method (Fig. 3E) while supporting the view that non-native subjects had a slightly lower SRT than the native subjects, in contrast to our expectation.
Discussion
The present study aimed to examine several important factors of the DIN test-hearing status, types of stimulus and background noises, and effects of language competency-by using a systematic review and meta-analysis techniques. The studies were screened and confirmed based on these inclusion and/or exclusion criteria. Fourteen studies were identified for a specific eligibility process of that review and quantitatively synthesized to conduct a meta-analysis.
When conducting the DIN tests, is it sensitive in difference between patients with and without hearing loss?
The hearing status of subjects was significantly affected by the results of the DIN test. In other words, this meta-analysis showed that individuals with hearing loss needed higher SNR to achieve similar performance than did adults without hearing loss. In fact, hearing loss reflects high hearing thresholds, creating difficulties with discriminating and understanding incoming speech sounds; patients therefore need a better hearing condition, such as higher SNRs. The correlation between pure-tone average (PTA) and SRT could be a way of demonstrating the consistency between two thresholds [11]. A positive and significant correlation between PTA and the DIN test was also found in the results of our subgroup analysis. These relationships of three thresholds are supported by Denys, et al. [4] who demonstrated a high correlation from Pearson’s r value of 0.66 to the 0.86 between PTA and SRT measured by the DIN test, while providing useful information to use when diagnosing a hearing loss.
Smits, et al. [11] found a strong positive correlation between a speech-in-noise test and the DIN test (r=0.866). This result was also confirmed by our present study. When considering the characteristics of the test material, however, the DIN test was less affected by contextual cues and linguistic factors [7,10] than the speech-in-noise test was when using a word or sentence. In addition, it showed a good (r>0.7) correlation with PTA [11]. Taken together, the DIN test was validated as a way to screen for a hearing loss.
Are the results of DIN test affected when different types of background noise are being presented?
The kind of background noise affected the results of the DIN test. When comparing speech-spectrum noise to multitalker babble noise (MTBN), Ebrahimi, et al. [6] concluded that the speech-spectrum noise showed better (or lower) SRT in the DIN test than did MTBN. In contrast, the interrupted noise with amplitude-modulated characteristics gave the benefit to the DIN test over steady-state noise in the study by Smits, et al. [13], especially for US English. This inconsistency is attributed to complicated effect of both types of noise and the characteristics of the participants. As a simple example, the MTBN had a unique masking feature, called informational masking. In general, noise physically and/or acoustically interferes with speech signals; this is energetic masking. Unlike the energetic masking, informational masking perceptually interrupts the speech signal and is derived from noises such as MTBN [24]. A difference between energetic and informational masking is central processing during the presentation of the speech and noise. MTBN interferes with speech through phonological information and creates more confusion in the central processing than speech-spectrum noise does.
As the participants, people with and without sensorineural hearing loss were participated in the study of Ebrahimi, et al. [6] and Smits, et al. [13] recruited only young adults with normal hearing. Because the patients with sensorineural hearing loss [6], especially at elevated hearing thresholds in the high-frequency range, benefited less from acoustical factors, such as temporal and spectral modulation, the use of noise with frequency- or amplitude-modulation in the DIN test could explain the poor performance for patients with hearing loss [25]. The high frequency hearing loss had a higher correlation with DIN than normal hearing threshold in the presence of interrupted noise rather than broadband noise [14].
What is the most appropriate length of the digits being presented?
It is important to consider the differences among screening tools such as the length of the stimulus. The length of the stimulus could be interpreted as a digit with a monosyllabic or disyllabic structure and single, double and triple digits. Although the International Collegium of Rehabilitative Audiology guideline suggested that the number of syllables in the digit stimulus exclude the effect of phoneme duration which could be affected in a very low SNR condition [26], many studies of the DIN test demonstrated that monosyllabic and bisyllabic digits are less important in terms of perceptual difficulty [9-10,13]. Thus, this study discussed the length of one-, two-, and three-digit stimuli. Miler, et al. [20] confirmed a longer stimulus makes the psychometric function curve shift to the right side (or need higher SNRs). That is, the respondents tended to perform more poorly for longer stimuli than for the short ones.
On the one hand, Smits, et al. [11] agreed that a shorter stimulus could lighten any cognitive burden, such as memory capacity. On the other hand, Versfeld, et al. [27] argued that a long stimulus could increase the efficiency of measurement. They added that supporting a three-digit DIN test produced more reliable and accurate results. In the result of our meta-analysis, triple-digits had the lowest SRTs. However, it was a small difference (effect size: 1.538), and the studies with a triple digit had a large sample size because most studies used it as their stimulus. Wilson, et al.’s [3] comparison reported no noticeable difference between the two- and three-digit stimuli. Therefore, the length of stimulus for the DIN test depended on the testing purpose. When the test was performed for research purpose, the one-digit or two-digit stimulus offered a more accurate process for the measurement and analysis. If the DIN test is conducted for clinical and screening purposes, then the usage of a three-digit stimulus may save time.
Does the patient’s language ability affect the DIN test results?
Based on the subgroup analysis, there was a difference across languages; the DIN test developed with a patient’s mother tongue had lower SRT than did one developed using a second language. As we expected, all studies included in the subgroup analysis supported this result [7,9,13]. However, it is also important to take note of whether the differences across the languages actually occurred due to the language or other factors [7,28]. Zokoll, et al. [28] found meaningful differences in the DIN test for Dutch, German, and Polish, and emphasized consideration of differences in the languages, including spectral and temporal cues for the digits and/or background noise. For example, Smits, et al. [13] compared the results of the DIN test using Dutch and US English. They concluded that the DIN test with US English had a lower SRT than the Dutch one did, even though the subjects were native speakers of Dutch.
From the perspective of acoustical features, the gender of the talker (i.e., a male speaking Dutch and a female speaking US English), the style of speaking (concatenated Dutch and successive US English), and a root mean square level of the materials (-2.36 dB with Dutch and 0.37 dB with US English) were different [13]. These differences in acoustical features could reflect natural differences between the two languages [7,28]. The result of the subgroup analysis in this study revealed a difference across the languages, but this difference could be extrapolated in the internal natures of the languages and their external acoustical features.
In the analysis, DIN tests for native and non-native subjects was compared. Contrary to our prediction, non-native subjects showed a lower SRT on the DIN test [10]. We attribute this difference to the large difference in sample size. Although Potgieter, et al. [10] showed a significant and positive relationship between PTA and SRTs for the DIN test in both native South African English subjects (r=0.76) and non-native English subjects (r=0.69), the asymmetrical distribution of the subjects (i.e., 291 native subjects and 46 non-native subjects) could lead to the overweighted result toward non-native subjects in the determination of effect size calculation. Consequently, the result for non-native subjects was overestimated. Furthermore, the South African English speakers with high English competency accounted for approximately 86% of the participants [10]. In sum, the numbers in American English were already familiar to most people, so it might be possible to test without being overly concerned about the patient’s native language.
Limitations of study and further direction
Several limitations to this study warrant further study. First, although the DIN test is an effective screening tool, other important factors related to presentation and the gender of talkers were not analyzed [7,28]. Second, this study did not compare testing platforms. Although the DIN test can be used on a telephone, smartphone, or tablet, it is necessary to validate each type of platform and to identify whether each platform could provide their designated purpose. Along with the platforms, the effect of types of transducer should be considered. Third, the slope of the DIN test which expressed in the psychometric function curve should be analyzed and discussed to confirm the reliability and validity of the DIN test. Finally, the results of a meta-analysis showed a high level of heterogeneity although each study still had high quality. In other words, the absence of systematic methodology, such as acoustical features (i.e., differences between genders, style of speaking, and the intensity level of material presentation) and the optimization process (i.e., composition of the digits and background noise) led to the divergent results. In the future, a large-scale study with a specific and unified methodology should be conducted to minimize inconsistent results and confirm the reliability and validity of the DIN test.
In sum, the DIN test was developed for several languages and has been evaluated using a well-designed and systematic process. The components of the test including stimuli and background noise were also tried. A more elaborate procedure, such as an optimization process, would produce a clear comparison across languages and confirm the value of the DIN test for hearing screening in a variety of settings.
Supplementary Materials
The online-only Data Supplement is available with this article at https://doi.org/10.7874/jao.2021.00416.
Supplementary Fig. 1.
The developmental history of various languages for the digit-in-noise test over two decades.
Acknowledgements
This work was supported by the National Research Foundation of Korea (NRF) grant funded by the Korea government (MSIT) (2019R1F1A1053060).
Notes
Conflicts of interest
The authors have no financial conflicts of interest.
Author Contributions
Conceptualization: all authors. Data curation: Chanbeom Kwak, Woojae Han. Formal analysis: Chanbeom Kwak, Woojae Han. Funding acquisition: Woojae Han. Methodology: Chanbeom Kwak, Yonghee Oh. Project administration: Jae-Hyun Seo, Woojae Han. Resources: Jae-Hyun Seo, Woojae Han. Software: Chanbeom Kwak. Supervision: Jae-Hyun Seo, Yonghee Oh, Woojae Han. Validation: all authors. Visualization: Jae-Hyun Seo, Yonghee Oh. Writing—original draft: Chanbeom Kwak. Writing—review & editing: all authors. Approval of final manuscript: all authors.