Investigation of the Correlation Between the Visually Induced Motion Sickness Susceptibility Questionnaire and the Turkish Motion Sickness Susceptibility Questionnaire
Article information

Abstract
Background and Objectives
Visually induced motion sickness (VIMS) is a phenomenon similar to motion sickness frequently observed in users of visual technologies. The Visually Induced Motion Sickness Susceptibility Questionnaire (VIMSSQ), developed by Golding et al. (2006), is considered the most effective scale for assessing VIMS susceptibility levels. The main purpose of this study was to standardize the selection of participants for research conducted with virtual reality, especially motion sickness (MS) research. To achieve this, first, the Turkish version of the VIMSSQ was created to establish its validity and reliability, and subsequently, its correlation with the Turkish Motion Sickness Susceptibility Questionnaire Short form (HDDA), the expanded version of the Motion Sickness Susceptibility Questionnaire Short form (MSSQ), was examined.
Subjects and Methods
Linguistic equivalence assessment was obtained from ten experts by passing the VIMSSQ through the translation process. The VIMSSQ and the Turkish MSSQ forms were then administered to 49 subjects. This study statistically analyzed the validity and reliability of the VIMSSQ and its relationship with the MSSQ.
Results
Results showed that the Turkish version of the original questionnaire is highly reliable (Cronbach alpha=0.843). There is a moderate statistically significant positive correlation between the total MSSQ scores and the subfactors of the VIMSSQ.
Conclusions
In this study, VIMSSQ was successfully adapted to Turkish, normative data demonstrated its validity, and all sub-factors were highly reliable. The Turkish version of the VIMSSQ can serve as a valuable tool for estimating individual susceptibility to VIMS.
Introduction
Motion sickness (MS) is a complex syndrome that is as old as history and occurs in various movement states. As technology has improved and motion conditions have diversified, there have been changes and developments in the classification of motion sickness [1]. While maritime transportation took its place as sea sickness in the MS literature with the invention of the ship, later on, following the technological developments, subclasses began to emerge according to various provocative stimuli such as car sickness and air sickness [2]. Furthermore, after the development of tools representing strong visual stimuli, such as flight simulators and driving simulators, it has been observed that individuals using these simulators show similar symptoms [3-5]. Therefore, simulator sickness and then virtual reality (VR) sickness were added to the literature. McCauley and Sharkey [6] defined these tables as created by various motion-based virtual environments that allow visual, vestibular, and proprioceptive input under one roof. It was defined as “cyber sickness” as a more general term [7] then visually induced motion sickness (VIMS) [1].
These developments have brought about different measurement tools. All these developments have led to a better understanding of these syndromes [8]. It became clear that traditional MS and VIMS are symptomatically differentiated. Because MS occurs due to the conflict of sensory inputs perceived in a physical motion, therefore complex autonomic nervous system responses are formed. Primary symptoms are nausea, vomiting, thermoregulatory disruption (e.g., pallor of the face, sweating/cold sweats, flashes), increased salivation, drowsiness, and vertigo/dizziness [2-9]. In VIMS, the main triggers are visual stimuli. It is based on the fact that the information received from the visual sensors contains motion components and creates a false perception of motion without a physical motion. While in the presence of physical motion, the primary symptom is nausea, in the case of false (visual) motion, the primary symptom is headache [1]. In 2021, at the Barany Society consensus meeting, the classification committee decided that VIMS is not a subgroup of MS but a different form and that the diagnostic criteria and these two disorders are differentiated from each other [1]. In studies related to VIMS, different subjective measures, such as the Virtual Reality Sickness Questionnaire (VRSQ) and especially Simulator Sickness Questionnaire (SSQ), are used symptomatically to measure the discomfort felt by the person at that moment [3,5,10-12]. These scales do not question individual susceptivity. The Motion Sickness Susceptibility Questionnaire (MSSQ) Short form is considered the most efficient and preferred scale for assessing the level of motion sickness susceptibility [11-14]. However, this scale is for general MS, not just VIMS susceptibility. Therefore, Golding and Keshavarz [15] created the Visually Induced Motion Sickness Susceptibility Questionnaire (VIMSSQ) specifically to measure VIMS susceptibility. MSSQ Short form normalization study was conducted in 2006 by Golding [11]. Visual (optokinetic) cinerama, video games, and virtual reality sickness items showed low prevalence as a source of sickness in the general population studied and, moreover when included, added no significant information in terms of pre-predictive variance. Therefore, these items were not included in the questionnaire. However, Ugur, et al. [12] concluded that it was useful to add these items to this scale in their studies on the Turkish adaptation of the MSSQ (HDDA), and the questionnaire was expanded by adding simulators and two items questioning virtual reality systems to the questionnaire. When all these factors are taken into consideration, it has become necessary to use a measurement tool that unifies all other questionnaires and specifically questions the predisposition of VIMS. For this purpose, the first VIMS questionnaire, VIMSSQ, was developed by Golding and Keshavarz [15]. The prototype of the questionnaire was very long, with 67 items [15]. Therefore, the final version of the VIMSSQ was created by abbreviating it.
Today, VR systems have become frequently used tools in academic research [16-18]. Therefore, the correct establishment of methodologies in these studies and the measurement of conventional MS or VIMS susceptibility of the participants are very important for the reliability of these studies. Therefore, the main purpose of this study is to provide standardization in the selection of participants for research conducted with VR, especially MS research. For this purpose, first of all, the Turkish validity and reliability of VIMSSQ was ensured, and then its correlation with HHDA, the expanded version of MSSQ, was examined.
Subject and Methods
The research was discussed in Acibadem Mehmet Ali Aydinlar University Acibadem Health Organizations Medical Research Ethics Committee ATADEK meeting on the date Apr 22, 2022, and was approved with resolution 2022-07/42. The participants had provided written informed consent.
Measurement tools
The VIMSSQ [14] and MSSQ–Turkish Version (HHDA) [12] were used as data collection tools.
VIMSSQ, the latest version, is an English questionnaire consisting of three [14] questions. The first question examined the severity of the 5 essential symptomatic traits that are the Barany criteria (nausea, headache, fatigue, dizziness, and eyestrain).
The second question is about the discomfort the person feels and the frequency of individual avoidance behavior while using technological devices (e.g., smartphones, movie theaters, video games, tablets, and VR glasses) due to these symptoms. The items in the first two questions are scored between 0 (never) and 3 (frequently) on a Likert scale. Thus, the minimum score obtained from the questionnaire is 0, and the maximum score is 18 points. High scores indicate susceptibility to VIMS [14]. Lastly, the third question is an open-ended question that questions which devices are triggers.
HHDA is a Likert-type questionnaire that questions motion sickness susceptibility on a vehicle-by-vehicle basis for childhood and adulthood. The susceptibility score varies between 0–3. In addition, if the participant has not experienced the vehicles questioned in the scale, this vehicle is indicated as “t.” At the end of the scale, childhood, adulthood, and total susceptibility scores are calculated (Supplementary Fig. 1 in the online-only Data Supplement).
Study design
Since the study’s primary purpose was the Turkish adaptation of the scale, a stepwise translation process was followed initially (Fig. 1).

The translation process of Visually Induced Motion Sickness Susceptibility Questionnaire (VIMSSQ).
Sample group and administration of questionnaires
The study included 49 healthy participants whose native language was Turkish and who were thought to be frequently exposed to visual stimuli. Individuals, consisting of university students, university staff, hospital staff, and the public, were included in the study. The final version of the Turkish VIMSSQ and the HHDA was applied to the participants face to face. First, participants were informed about the intended purpose of the questionnaire and how to evaluate the questionnaire. Then, the questionnaire was given to individuals who accepted to participate.
Statistical analysis
In the statistical analysis of the study, IBM SPSS Statistics, Version 24.0 (IBM Corp., Armonk, NY, USA) is used in the explanatory factor analysis, internal reliability tests, and hypothesis tests applied to the scales, and Amos 16.0 (SPSS, Inc., Chicago, IL, USA) is used in the confirmatory factor analysis test.
Reliability of the questionnaire
The Cronbach’s alpha coefficient is used to determine internal reliability. The split half method Spearman-Brown correlation coefficient is used to evaluate the interclass reliability.
Validity of the questionnaire
Explanatory factor analysis
Explanatory factor analysis (EFA) is performed to evaluate the validity of the questionnaire. Some assumptions are evaluated before performing factor analysis. The Kaiser-Meyer-Olkin (KMO) criterion is examined for sample adequacy. The KMO index is an index that compares observed correlation coefficients and partial correlation coefficients. In this study, the KMO criterion is found as 0.723, indicating that the sample size is suitable for factor analysis.
The Bartlett test evaluates that the diagonal elements of the correlation matrix are one and the non-diagonal terms are 0. This test also shows the fit of the data to multiple normal distributions. In this study, it can say that the population correlation matrix is not the unit matrix since Bartlett test calculated p<0.001 at the 0.05 significance level. Thus, factor analysis can be performed.
The diagonal values of the anti-image correlation matrix vary between 0.603 and 0.836. This range indicates that the sample size is suitable for factor analysis.
Confirmatory factor analysis
Confirmatory factor analysis (CFA) was conducted based on structural equation modeling (SEM). Estimation values are provided in the path diagram obtained as a result of confirmatory factor analysis. Since the questions are distributed normally, the maximum likelihood estimation is used as the estimation method. The fit indices evaluate the model’s performance (χ2, godness-of-fit index [GFI]; adjusted goodnessof-fit index [AGFI]; comparative fit index [CFI]; root mean square error of approximation [RMSEA]).
Other analysis
The normality assumption is checked by using the Shapiro-Wilk test. Spearman’s rho correlation coefficient was used for the correlation analysis of VIMSSQ and MSSQ which are distributed non-normally (p<0.05). Also, the Mann-Whitney U test was used to compare two independent non-normally groups in between the gender variance of the data (p<0.05).
Results
The study included 35 (71.4%) female and 14 (28.6%) male participants aged 22.12±5.71 years (18 to 46). Participants were given MMSQ and VIMSSQ simultaneously and asked to fill out the questionnaire. According to the participants’ responses to the MSSQ, they were not susceptible to motion sickness at the moment, and their susceptibility was slightly higher in childhood (6.69±8.24). The participants also reported that they rarely felt the symptoms of VIMS when their responses to the first question of the VIMSSQ were examined. Furthermore, none of the participants abstained from using technological equipment due to VIMS symptoms although they rarely reported discomfort (Table 1).

Distribution of variables of study participants
The third question of VIMSSQ is, “Which device triggers your complaints?” Among the responses given to the question, one of the most frequent triggers was mobile phones, followed by computers and simulators (Table 1).
Analysis of reliability and validity of the VIMSSQ
Internal and interclass consistency
The overall Cronbach’s alpha value was found as considerably high as 0.843 based on the reliability analysis. The split half method Spearman-Brown correlation coefficient was used to evaluate interclass consistency (Spearman-Brown coefficient r=0.736).
EFA
“Principal components analysis” is used to determine the structure of the factors. The total variances explained are given in Table 2 and Fig. 2. In this study, two factors explain 75.2% of the total variance.

Rotation sums of squared loadings
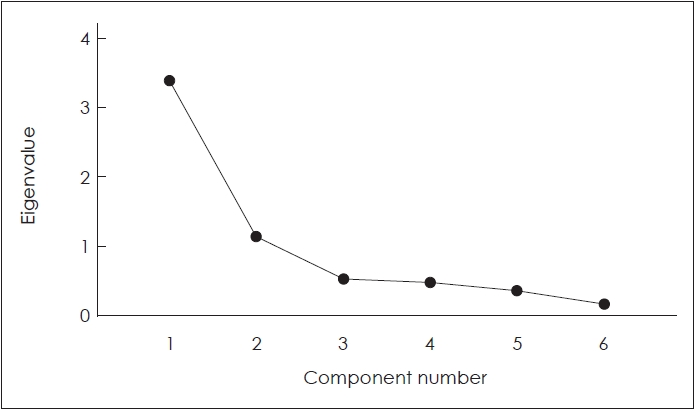
Scree plot of explanatory factor analysis.
Rotation sums of squared loadings
According to the EFA and rotated factor loadings obtained from varimax rotation, the questionnaire consists of two factors. Factor 1 includes headache, fatigue, eyestrain, and the second question of VIMSSQ. Factor 2 includes nausea and dizziness (Tables 3 and 4).

Rotational components matrix of EFA for VIMSSQ

Distrubition of factors
CFA
SEM was used for CFA. The model to be tested for this purpose was created using six observed and four latent variables (factor 1, factor 2). In the model, rectangles represent observed variables (items), oval ones indicate latent variables (sub-dimensions), and circles represent error or unexplained variance (Fig. 3). The fit index values for this measurement model were found as the degree of freedom=19, p<0.022, CMIN/DF (chi-square value/degree of freedom)=1.143, RMSEA=0.054, χ2=30.672, NFI (normed fit index)=0.936, CFI=0.991, and TLI (Tucker-Lewis index)=0.976. Accordingly, the model output predicted by the most likelihood estimation method is presented in the path diagram (Fig. 3). The model was found to be statistically significant (p<0.05) (Table 5).

The path diagram of modified CFA model according to EFA. CFA, explanatory factor analysis; EFA, explanatory factor analysis.

Goodness-of-fit indices
VIMSSQ and MSSQ correlation analysis
There is a moderate (0.50<r<0.60) statistically significant positive correlation between the total MSSQ scores and sub-factors of VIMSSQ (Spearman’s rho, p<0.05) (Table 6 and Fig. 4).

VIMSSQ and HHDA correlations
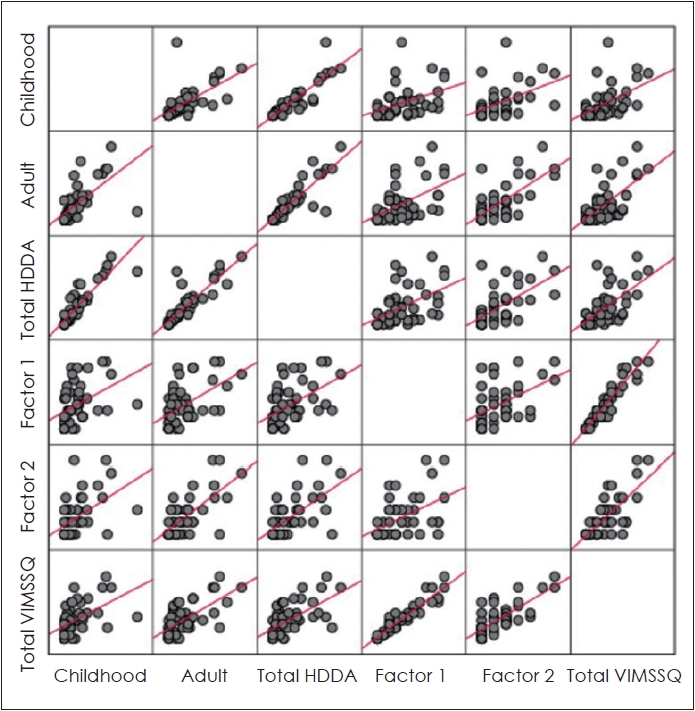
Correlation indicates association between HDDA and VIMSSQ. VIMSSQ, Visually Induced Motion Sickness Susceptibility Questionnaire; MSSQ, Motion Sickness Susceptibility Questionnaire; HHDA, MSSQ in Turkish.
Comparisons by gender
There was a statistically significant difference in the MSSQ total score and sub-factors of VIMSSQ distribution according to gender (Mann-Whitney U test, p<0.05). The average of females (childhood 8.24±9.1; adulthood 8.22±7.89; total 16.86±15.43) is higher than that of males (Table 7).

Comparison of scales according to gender
Discussion
To be perceived as reality, VR technologies enable synthetic environments. For this reason, it is frequently used in education, entertainment, rehabilitation, and academic research [7]. VR technologies, which allow the establishment of an unlimited variety and controlled experimental environment, have started to be preferred in academic studies, especially in experimental fields. Research costs and risks can be minimized by creating experimental environments in a virtual environment. On the other hand, these technologies can cause VIMS, characterized by signs and symptoms such as headache, fatigue, eyestrain, and nausea. Therefore, VIMS is an essential limitation of virtual reality technologies [1,15]. Knowing the VIMS sensitivity of individuals is an important factor for research methodology and participant selection in virtual reality studies. This study aims to determine the appropriate measurement tool to standardize the inclusion criteria in virtual reality-based experimental academic studies.
The diagnosis of VIMS is based on patient history. Although there are various measurement tools, unfortunately, none of them are in Turkish. In 2021, Ugur, et al. [12] expanded the questionnaire by adding VR and simulator items in their study on the Turkish adaptation of the MSSQ short form. However, this new version of MSSQ-short (HHDA) does not specifically evaluate VIMS susceptibility, although it questions VR and simulator susceptibility. In fact, the only measurement tool in the literature to specifically evaluate VIMS sensitivity was the VIMSSQ by Golding, et al. [14], which he brought to the literature in 2021. This study investigated the correlation between VIMSSQ and HHDA, the expanded version of MSSQ. For this reason, in the first stage of the study, VIMSSQ was adapted to Turkish. Reliability is one of the most critical features that measurement tools must have. Reliability is an indicator of the stability of those measurement tools. For this purpose, VIMSSQ was first adapted to Turkish, and its reliability validity was investigated. Statistical data from the study determined that the Turkish VIMSSQ form and all sub-factors were quite reliable [19,20]. As a result of exploratory factor analysis, Turkish VIMSSQ items were gathered under two factors. The fact that these two factors account for 75% of the total variance indicates that the scale is a reliable measurement tool [19,20]. In addition, when the sub-factors were analyzed, it was seen that the symptoms clustered under the 1st factor were headache, fatigue, and eyestrain. Nausea and dizziness were grouped under factor 2. In traditional motion sickness, the primary symptom is nausea [1,2], whereas, in VIMS, oculomotor and central effects are the first prominent symptoms [1]. Results suggest that the VIMSSQ reflects the distinction between MS and VIMS.
The symptoms that occur in MS and other forms (e.g., VIMS, Mal de debarquement syndrome) significantly reduce individuals’ balance control and quality of life. For this reason, most individuals turn to protection-avoidance behaviors [21-23]. In the second question of VIMSSQ, the behaviors of individuals to stop using and avoid using screens/screens due to symptoms are questioned. The participants’ answers to this question were gathered under the 1st factor. This finding suggests that individuals tend to engage in protection-avoidance behavior with the onset of oculomotor symptoms [21]. In addition, various studies using visual tasks and stimuli have reported that cognitive and visual tasks impair balance control. From this perspective, it is unsurprising that individuals with VIMS sensitivity tend to engage in protective and avoidance behaviors [22,23].
VIMS is a common side effect when watching dynamic visual content from various displays such as virtual reality, video games, tablets, or smartphones [13,24,25]. Therefore, in the third question of VIMSSQ, individuals are asked which devices trigger the symptoms. The participants included in our study are generally individuals without MS or susceptibility to VIMS. Participants reported smartphones as the highest trigger of VIMS. They also reported that computers and simulators are other important trigger screens. The reason why smartphones are in the first place may be that they are more accessible devices than others. Also, people always use their phones, even while walking or running. As a result, the mobilization of individuals during smartphone use may be an essential trigger for visual-vestibular conflict. Furthermore, screens like VR systems provide better immersion as they offer a stereoscopic view. Therefore, it creates more visual-vestibular conflict. Naqvi, et al. [24] and Dennison, et al. [26] showed that 3D screens cause more symptoms than 2D screens. However, it should not be forgotten that all displays that provide visual warnings can be considered provocateurs for everyone. In addition, the frequency of access and use of these displays is another provocative factor.
Females are more susceptible than males to MS, Mal de debarqument syndrome, and VIMS [1,27-29]. This is thought to be related to gonadal hormones [25,26]. In the responses of the participants from MSSQ Turkish and all the items in VIMSSQ question 1, there was a statistically significant difference between the gender in accordance with the literature. Females are more susceptible to MS and VIMS. Studies investigating the effectiveness of gonadal hormones in gender dominance can provide more meaningful results by examining the relationship between VIMS and the menstrual cycle.
In this study, VIMSSQ adapted to Turkish and normative data for demonstrated its validity, and all sub-factors were highly reliable. The Turkish version of VIMSSQ can be a valuable tool for estimating individual susceptibility to VIMS. The symptoms of VIMS are clearly dissociated from MS. The primary symptoms of VIMS are eyestrain, fatigue, and headache.
There is a moderate statistically significant positive correlation between the total MSSQ scores and sub-factors of VIMSSQ. For this reason, it is more beneficial to use the MSSQ short form and VIMSSQ together for inclusion criteria in academic studies researching especially virtual reality-based MS.
Supplementary Materials
The online-only Data Supplement is available with this article at https://doi.org/10.7874/jao.2023.00122.
Supplementary Fig. 1.
English and Turkish version of VIMSSQ and MSSQ.
Acknowledgements
I would like to express our sincere gratitude to Neslihan Gokmen Inan from Koc University Computer Department and Acibadem University Foreign Languages Department for their technical support.
Notes
Conflicts of Interest
The author has no financial conflicts of interest.