Musical Aptitude as a Variable in the Assessment of Working Memory and Selective Attention Tasks
Article information

Abstract
Background and Objectives
The influence of musical aptitude on cognitive test performance in musicians is a long-debated research question. Evidence points to the low performance of nonmusicians in visual and auditory cognitive tasks (working memory and attention) compared with musicians. This cannot be generalized to all nonmusicians, as a sub-group in this population can have innate musical abilities even without any formal musical training. The present study aimed to study the effect of musical aptitude on the working memory and selective attention.
Subjects and Methods
Three groups of 20 individuals each (a total of 60 participants), including trained-musicians, nonmusicians with good musical aptitude, and nonmusicians with low musical aptitude, participated in the present study. Cognitive-based visual (Flanker’s selective attention test) and auditory (working memory tests: backward digit span and operation span) tests were administered.
Results
MANOVA (followed by ANOVA) revealed a benefit of musicianship and musical aptitude on backward digit span and Flanker’s reaction time (p<0.05). Discriminant function analyses showed that the groups could be effectively (accuracy, 80%) segregated based on the backward digit span and Flanker’s selective attention test. Trained musicians and nonmusicians with good musical aptitude were distinguished as one cluster and nonmusicians with low musical aptitude formed another cluster, hinting the role of musical aptitude in working memory and selective attention.
Conclusions
Nonmusicians with good musical aptitude can have enhanced working memory and selective attention skills like musicians. Hence, caution is required when these individuals are included as controls in cognitive-based visual and auditory experiments.
Introduction
The auditory and cognitive performance of musicians has intrigued scientists for the past two decades. In the past, several studies have shown that long-term musical experience induces neuro-plastic morphological [1] and functional changes [2]. Musicians exhibit experience linked superior performance in musical skills and the neural underpinnings of this advantage is reflected as morphological changes in their auditory cortices [3]. More recently, auditory scientists report advantages of musical training on auditory abilities such as speech perception in noise [4], pitch perception [5], and cognitive functioning, including memory and attention. The conglomeration of research findings suggests that musical training induces plausible changes in working memory and attention across both auditory and visual modalities [6].
Working memory refers to one component of the short-term memory (the ability to acquire, process, retain, and then recall information) system that can maintain, rehearse, and actively manipulate sensory information [7]. On the other hand, attention permits the individual to focus particularly on the event of importance and improves memory. Attention and working memory are closely related because paying attention to specific information makes it easier to remember [8]. Musicians have been reported to outperform nonmusicians on all the tasks of working memory, including tasks of digit span, reading span, operation span, and spatial span [9]. In addition, a significant correlation has also been reported between their musical competence and performance in memory span tasks [10]. Pertaining to the selective attention tasks, musically trained adults showed superior performance on Flanker’s task compared to age-matched nonmusicians [11].
Although the literature points at the numerous advantages of musical training on working memory and attention tasks, it fails to address the influence of pre-existing musical advantage that some nonmusicians (musical sleepers) seem to enjoy in certain auditory tasks. Studies report of improved performance of musical sleepers in auditory-related tasks, which materialize as analogous neuroplastic benefits as observed in musicians [12]. Mankel and Bidelman [12] showed enhanced brain potentials (frequency-following responses [FFR]) to speech in individuals with intrinsically proficient auditory systems (musical sleepers), which was similar to proficient musicians. This finding is indicative of similarity in auditory neurobiological function for both musically trained and untrained individuals with pre-existing musical aptitude. The similarity in neural underpinnings between these groups (trained musicians vs. nonmusicians with good musical aptitude) might also get reflected on behavioral tests, which when surfaced can obscure the group differences (musicians vs. nonmusicians, if musical sleepers are included). Although the effect of musical training on the working memory and selective attention performance is established [10,11], the scope of narrowing the effect size or group differences (musicianas and nonmusicians) cannot be ruled out as these reports do not caution on the existence of musical sleepers included (as nonmusicians) in their study.
A plethora of factors such as the age of inception of musical training [13], years of musical practice [14], and innateness of musical abilities [15] have been proved to influence the results in studies concerning benefits from musicial training. However, when innateness is considered as a variable that could influence results, the existence of “musical sleepers” (individuals who have the innate musical ability but no formal musical training) as a sub-group within nonmusicians can be postulated as an explanation for reduced group differences [12,16]. It is of importance because such “musical sleepers” might perform better in the experiments than actual nonmusicians or perform at par with musicians while being considered as a nonmusician. The inclusion of musical sleepers in the nonmusical could be the possible reason behind contradictory findings of lack of significant advantage or reduced effect size of musicianship on a spectrum of psychoacoustical and cognitive tests [17].
The present study aimed to investigate the effect of musical aptitude on working memory (backward span and operation span) and selective attention (Flanker’s task). For this purpose, three groups of individuals: true-musicians, nonmusicians with musical aptitude (musical sleepers), and nonmusicians with low musical aptitude were recruited in the present study. Both true musicians and nonmusicians had a good musical aptitude, with the only difference that the former received musical training, while the third group, i.e., nonmusicians with low musical aptitude, had neither. It was also of our interest to explore the best matric which predicts the differences in musical aptitude based on participant’s performance these tests (working memory and selective attention).
Subjects and Methods
The study was conducted on 60 participants, who were divided into three groups of 20 each. Group 1 consisted of musicians (age 23.25±2.25 years, mean±SD; 12 females, 8 males) who were trained in vocal Carnatic music (minimum of 5 years, age of training 7.24±1.27 years, mean±SD) and practiced one hour of music, at least five days a week. Group 2 comprised nonmusicians with good musical aptitude (age 21.5±1.5 years, mean±SD; 11 females, 9 males), and group 3 were nonmusicians with low musical aptitude (age 24.5±2.75 years, mean±SD; 10 females, 10 males). Nonmusicians with good and low musical aptitude were recruited based on the outcomes from mini-Profile of Music Perception Skills (mini-PROMS) [16] and Questionnaire on Music Perception Ability [18]. Only participants who had obtained similar classification scores (good or low musical aptitude) on both the tests were included in the study. Although initially 66 participants volunteered for the study, the data of 6 participants was ignored as their mini-PROMS and musical perception abilities questionnaire scores posed contradictory findings (participants whose cut-off better scores in mini-PROMS but scored relatively poorer with the questionnaire or vice versa).
Mini-PROMS is a short online test that assessed the musical ability objectively within 20-25 minutes. The test is divided into four subsections—tonal, qualitative, temporal, and dynamic. It employs a discrimination task to elicit responses. Each sub-test is designed to measure one of the psychoacoustical aspects involved in music perception: tonal (melody, pitch), qualitative (timbre, tuning), temporal (rhythm, rhythm-to-melody, accent, tempo), and dynamic (loudness). The mini-PROMS has satisfactory psychometric properties with moderate to high test-retest reliability (composite score: >0.85; individual subtests -0.56 to 0.85) and validity (both criterion and discriminant validity) [19,20]. The overall composite and individual sub-tests scores were computed. The maximum score obtainable was 36, and a minimum cut-off score of 18 was required to classify an individual to have a good musical aptitude. The test was administered using a Dell Inspiron 3000 (Dell Inc., Round Rock, TX, USA) laptop and Sennheiser HD 440 BT headphones (Wedenmark, Germany). The questionnaire on music perception ability had questions related to different parameters of music such as pitch awareness, pitch discrimination, pitch identification, timber identification, melody recognition, and rhythm perception. Those who scored more than 15 were considered as individuals with good musical aptitude, and less than 15 were grouped into individuals with low musical aptitude.
Fig. 1 shows the mean overall mini-PROMS scores of the three groups of participants along with their individual raw data as a scatter plot. The group segregation based on the mini-PROMS test (musicians, nonmusicians with good and low musical aptitude) compared using one-way analysis of variance (ANOVA), revealed a significant main effect of the group [F(2,57)=63.34, p<0.001]. On Bonferroni, the mini-PROMS scores of musicians were shown to be significantly higher (p=0.04) than nonmusicians with good musical aptitude, whose mini-PROMS scores were in turn significantly higher (p<0.01) than the nonmusicians with low musical aptitude. As seen in Fig. 1, the group segregation using mini-PROMS was effective, suggestive of the appropriateness of the groups considered in the study. This was further complimented by the findings of the one-way ANOVA on the musical aptitude scores obtained on questionnaire on music perception ability. ANOVA revealed a significant main effect of the group [F(2,57)=168.34, p<0.001], which on post-hoc Bonferroni showed that the musicians (mean±SD, 25.85±1.57) and nonmusicians with good musical aptitude (mean±SD, 20.40±2.56) had scored significantly (p<0.001) higher than nonmusicians with low musical aptitude (mean±SD, 13.10±2.65) on musical perception ability questionnaire.

Group segregation based on mini-PROMS scores (max score= 36). The red cross indicates the mean of the corresponding groups with the error bars indicating one standard deviation. The asterisks denote the level of significance between the group comparisons (*p<0.05, **p<0.01). mini-PROMS, mini-Profile of Music Perception Skills.
Also, a detailed case history was taken to eliminate the history of otologic problems and any other cognitive deficits. Any deficits in hearing sensitivity were ruled out using screening audiometry. The screening was performed separately for the two ears using audiometer Maico MA 52 (Maico, Berlin, Germany) coupled to TDH-49 headphones (Telephonics, Farmingdale, NY, USA). The pure-tone air-conduction thresholds at 0.5, 1, and 2 kHz were obtained for all the participants. Participants whose hearing sensitivity was ≤15 dB HL were diagnosed as normal hearing and were included in the study. Data related to musical experience was also obtained from the musicians’ group. Subsequently, the working memory (backward digit span and operation span) and selective attention (Flanker’s test) tests were administered.
At the start of each test, the A-Random Letter Test of Auditory Vigilance (A-Test) [21], which is a part comprehensive mini-mental status examination, was conducted to cross-check the motivational levels in the participants of the study. This test has been established as a symptom validity variable and can be applied as a test to check the level of vigilance in the participants, using a task that is otherwise not related to the main crux of the study. A prior informed consent was obtained from all the participants at the start of the study. All procedures performed in the current study were approved by institutional ethical and research board (Ref: AIISH/2020-21:AUD_07). The guidelines of the institutional ethical committee for human bio-behavioral research were followed. These guidelines adhered to the standards of the Helsinki declaration [22].
Operation span
The operation span (OS) test used in the current study was adapted from the Smriti-Shravan module [23]. The laptop (Dell Inspiron 3000) loaded with this module connected to the Sennheiser HD 440 BT headphones were used to present the stimuli. In this test, the participant’s ability to remember the target stimuli presented auditorily was assessed. The distracting stimulus is presented visually along with a secondary task. The target stimulus was an English word, while solving an arithmetic problem served as a secondary task/distracting stimulus. The arithmetic problem and the target words were alternatively given. The participant taking the test was asked to solve the equation (e.g., 10/5+2=8) and respond to it by selecting either true/false. Further, the participant was asked to remember the word that follows. This alternated a number of times. The individual, after a certain number of alterations, had to recall and select all the words presented in the exact order of presentation. Ten practice trials were given prior to the actual test. The total test trials were 12, and the test duration was approximately 12 minutes. The flow chart of the operation span test is given in Fig. 2.
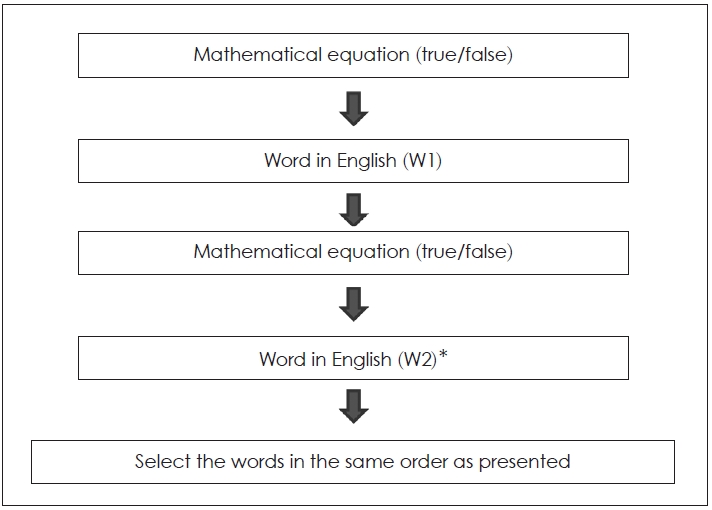
The schematic representation of the stimuli used in the operational span test (adapted from Smriti-Shravan module). *Number of words (W) randomly vary from 3 to 8.
Scoring and analyses
Guidelines recommended by Conway, et al. [24] were followed during the scoring. A score of 1 was assigned for every word correctly recalled. The output of the test was automatically saved into an excel sheet, and data was later extracted for statistical analyses.
Backward digit span
Similar to the operational span test, backward digit span was conducted using Smriti-Shravan Module [23], which was loaded on the Dell Inspiron 3000 laptop. Sennheiser HD 440 BT headphones were used to deliver the stimulus to the ears. Backward digits span is a memory and sequencing task in which the participant had to memorize and recall the auditory stimuli (numbers) in reverse order. In the test, groups of digits were presented in random order with increasing difficulty (a correct response on the first trail containing four sets of digits led to the presentation of a relatively difficult sequence containing five digits, which upon correct recitation was followed by the next complex sequence containing six digits). The stimuli consist of numerals from one to nine except seven (which is excluded as its bisyllabic). The participants were told to repeat the numbers in the reverse order of presentation. If the sequence of numbers presented were 4, 0, 5, 6, 9, the correct response would be 9, 6, 5, 0, 4. Ten practice trials were given prior to the actual test. The total test administration was completed in approximately 10 minutes. A schematic representation of the steps involved in the backward digit span is shown in Fig. 3.
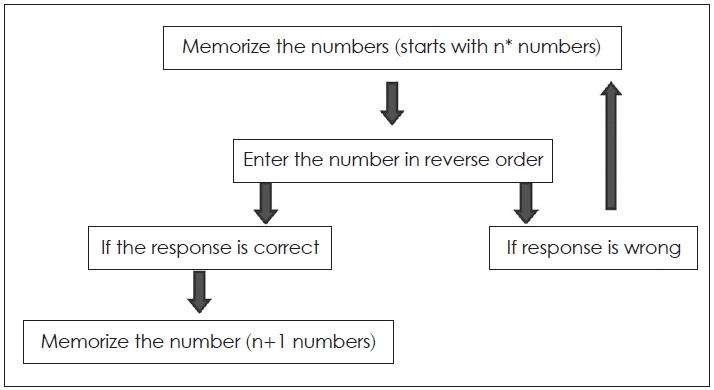
The schematic representation of the stimuli used in the backward digit span test (adapted from Smriti-Shravan module). *Here n starts with 2 and maximum limits is 10.
Scoring and analyses
The scoring was based on the one-up, one-down adaptive procedure. The final score was the midpoint of the last three reversals. Backward digit span is calculated as the total number of digits that the person can successfully recall in reverse order. The output of the test was automatically saved into an excel sheet and was later tabulated for statistical analyses.
Flanker’s test
The Eriksen Flanker’s test [25] was administered to measure the selective attention of participants. The test was conducted using E-Prime 2.0 [26] loaded on the laptop (Dell Inspiron 3000). In this task, the participants were involved in recognizing the target stimulus among a blend of congruent and incongruent surroundings. A total of 10 practice trials were given at the start of the test, with each condition at least being presented twice. Test commenced after the participants were actively able to discriminate 80% of practice trials. The participants were asked to press appropriate buttons on the keyboard, depending on the stimulus. For example, the left arrow key needs to be pressed by the participants when the target in the center corresponds to the “<” symbol, while the participant was instructed to press the right arrow key whenever he/she sees a symbol “>” in the center. A series of 5-7 symbols appeared on the screen, and the participant is asked to choose the target symbol (in the center) and ignore the other distracters. For example, in the following symbols ###<###, the central target “<” is surrounded by a sequence of distracter symbol “#”. The symbols in the neighborhood of the central target stimulus are called ‘Flankers’. These can be neutral, congruent, or incongruent. The above example represents a neutral condition wherein the center target stimulus is embedded in the background of neutral symbols. The congruent condition is represented as <<<<<<<or>>>>>>>, where the Flankers have the same symbols as the target stimulus. For the incongruent condition, half the symbols on one side of the target were comprised of the same symbols as the target (<<<<>>>or>>>><<<). The participants were instructed to concentrate on the target stimulus irrespective of the Flanker conditions. Each condition was presented randomly for 30 trials. The test was completed within duration of 8-10 minutes.
Scoring and analyses
A score of 1 was given for each correct response, whose corresponding reaction time was also generated as output in the excel sheet. The overall accuracy (max score: 30) and the reaction time of each correct response was noted for each of the three conditions (congruent, incongruent, and neutral).
Statistical analyses
The raw scores of the collected data were subjected to statistical analysis using Statistical Package Social Sciences (SPSS), version 20.0 (IBM Corp., Armonk, NY, USA). Firstly, the Shapiro-Wilk test of normality was administered to decide on the type of statistics (parametric or nonparametric) to be employed for data analyses. To verify the appropriateness of mini-PROMS in musical aptitude categorization and deliante its association with working memory and attention, Pearsons test of correlation was performed. After establishment of appropriate group inclusion, descriptive statistics (mean and standard deviation) were done for all the measures (operation span, backward digit span, and Flanker’s selective attention) in the study.
Multivariate analysis of variance (MANOVA) was performed with groups (nonmusicians with good musical aptitude, nonmusicians with a low musical aptitude, and trained musicians) as a fixed factor, and test scores as dependent variables. MANOVA was done combinedly for all the measures used in the study. This was followed by one-way ANOVA and follow-up (Bonferroni’s test with correction for multiple comparisons) for each test. Whenever significant differences were found, the corresponding effect size (partial eta-square, ηp2) was reported. Furthermore, Fisher’s discriminant function analysis (FDA) was carried out for group classification based on the tests where a significant difference was revealed in one-way ANOVA. A default mathematical operation (Di=a+b1x1+b2x2+…+bnxn; Di=predicted discriminant score, a=a constant, x=predictor, and b=discriminant coefficient) run in SPSS 20.0 for group categorization was employed in the study. Based on the weights of the tests in the FDA, further in-depth analyses of group differences were conducted.
Results
The Shapiro-Wilk test of normality carried out on test performance (operational span, backward digit span, Flanker’s accuracy, and Flanker’s reaction time) across the three groups (segregated using mini-PROMS) showed that data followed a normal distribution (p>0.05). The results of correlational analyses showed that musical aptitude scores did not show significant relationship (p>0.05) with any of the measures (operational span, backward digit span, Flanker’s accuracy, and Flanker’s reaction time) considered in the study, as shown in Table 1.

Pearson correlation coefficients and their significance showing the relationship between musical aptitude and measures used in the study for the three groups
The descriptive statistics showed that the performance of the nonmusicians with good musical aptitude was comparable to the mean scores observed in musicians, whose performance, in turn, was better than nonmusicians with low musical aptitude, shown in Fig. 4. The results of MANOVA indicated a significant main effect of musical aptitude [F(2,57)=7.08, p=0.002; ηp2=0.19], tests [F(3,171)=1135.84, p<0.001; ηp2=0.95], and interaction of musical aptitude with tests [F(6,171)=7.10, p=0.002; ηp2=0.19]. When between-group effects for each of the test were studied separately using one-way ANOVA, a significant effect of musical aptitude was observed for backward digit span test and reaction time of Flanker’s test [overall operational span: F(2,57)=0.007, p=0.99; backward digit span: F(2,57)=3.87, p=0.03; Flanker’s overall accuracy: F(2,57)=0.24, p=0.79; Flanker’s overall reaction time: F(2,57)=7.09, p=0.002]. Further, the posthoc Bonferroni’s test indicated nonmusicians with good musical aptitude had statistically similar performances like musicians for both backward digit span (p=0.97) and reaction time in Flanker’s test (p=0.18). However, the performance of these two groups with musical abilities (nonmusicians with good musical aptitude and trained musicians) was significantly (backward digit span: p=0.04; Flanker’s reaction time: p=0.001) better (faster reaction time and higher backward digit span score) than the nonmusicians with low musical aptitude.

Individual scores of the three groups on operational span (A), backward digit span (B), Flanker’s overall accuracy (C), and Flanker’s overall reaction time (D) tests. The red cross indicates the mean of the corresponding groups, with the error bars indicating one standard deviation (SD).
Identification of the optimal test for group segregation based on musical abilities
FDA generated two discriminant functions that effectively categorized differences in musical abilities based on the tests, which showed significant differences in ANOVA. The details of variability accounted by the discriminant function (in decreasing order) are as shown in Table 2.

Results of discriminant analyses showing variability accounted by function 1 and function 2
The statistical significance of these functions in segregating the groups (with and without musical abilities) obtained using eigen value, and Wilk’s lamda (λ) showed first discriminant function (DF1) was statistically the most robust function (p<0.01) for the group segregation, which explained 90.4% of the overall variance in data. On the other hand, the second discriminant function (DF2) explained only 9.6% of the overall variance, with Wilk’s lamda (λ) falling short of statistical significance (p>0.05), as reflected in Table 2.
Table 3 shows the results of coefficients of each test, suggestive of weightage/relative contribution of each test in group segregation of participants on DF1 and DF2. The coefficient with large absolute values corresponds to overall reaction time in the Flanker’s test for DF1, indicative of higher discriminative abilities of this test for musical abilities categorization. DF2, although not statistically significant, had higher weightage on the backward digit span test.

Loadings of the variables on the two significant factors identified in the discriminant analysis
Based on the weights, the canonical discriminant functions obtained in the study are summarised below:
DF1: (0.92*reaction time) - (0.64*backward digit span),
DF2: (0.39*reaction time) + (0.77*backward digit span).
Further, the combined group plot, plotted using the two DFs (DF1 on abscissa and DF2 on the ordinate) and a cluster of classification values of Flanker’s reaction time and backward span tests for different groups, is shown in Fig. 5. Complimentary to Wilk’s λ, the combined group plot also depicted two distinct clusters of musical ability based on DF1. The DF1 helped in the segregation of two distinct clusters concentrated on either side of the reference line (Fig. 5, dotted line). While the symbols (blue dots) corresponding to the nonmusicians with low musical aptitude emerged as a cluster with positive weightage on the right side of the reference line, the other two groups (trained musicians and nonmusicians with good musical aptitude) were demarcated with negative weights on the left side of the reference line, indicative of the role of musical aptitude on working memory and selective attention abilities. A close visual inspection of Fig. 5 also revealed that 7/20 nonmusicians with good musical aptitude were also misclassified as nonmusicians with low musical aptitude, accounting for a classification error of 35%. However, the accuracy of group membership prediction for nonmusicians with low musical aptitude based on the FDA is 65%, which is a moderatehigh accuracy group membership prediction score. On the other hand, the group prediction accuracy for the trained musicians (19/20 yellow dots denote correct clustering) and nonmusicians with low musical aptitude (16/20 blue dots denote correct clustering) were both relatively high (95% in the former group and 80% in nonmusicians in latter group). The overall group membership accuracy prediction rates are 80%, suggestive of pronounced applicability of Flanker’s reaction time and backward digit span measures in segregating groups based on musical aptitude.
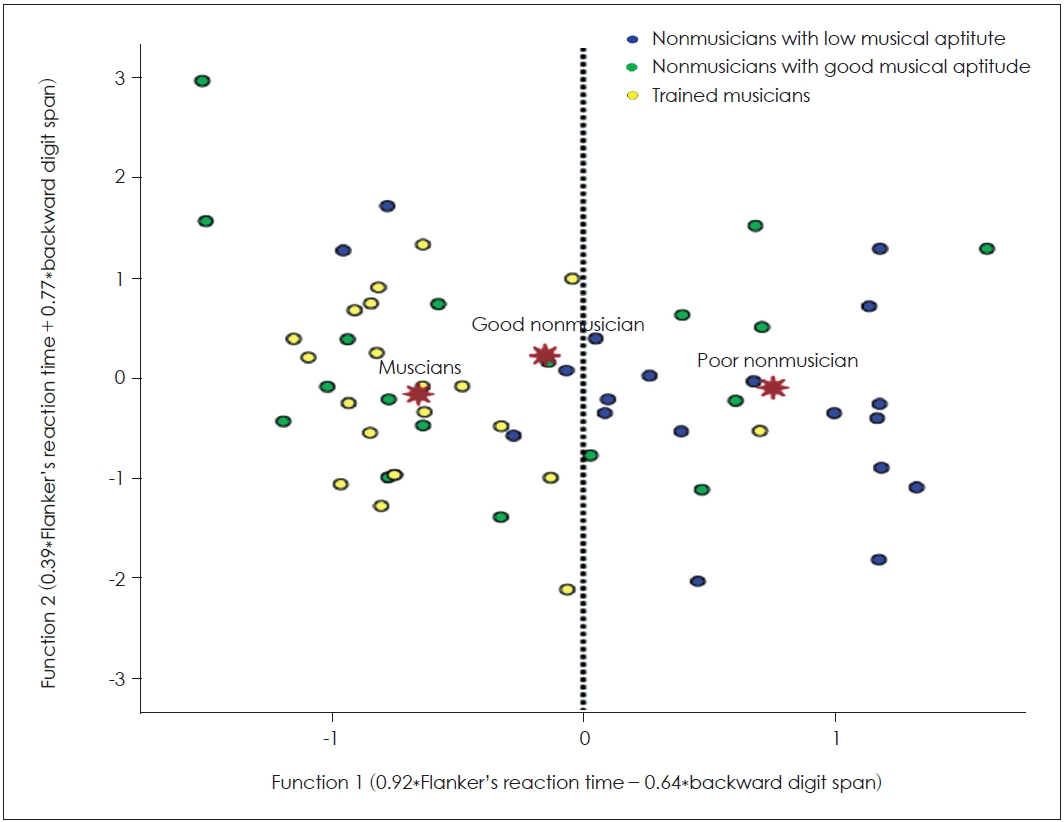
Grouping participants based on canonical discriminant scores derived for tests of Flanker’s reaction timeh predicted test and backward digit span. Group centeroids are indicated with asterisk (*) for each predicted group membership. The reference line (dotted) indicates the cut-off scores on Function 1 for group segregation (with and without musical ability).
Based on FDA, Flanker’s reaction time emerged as the best predictor test for quantifying musical abilities. Hence, a further detailed analysis was carried out using this test on the nature of stimuli used (congruent, incongruent, and neutral) in the Flanker’s test, whose descriptive statistics with mean and SD are shown in Fig. 6.
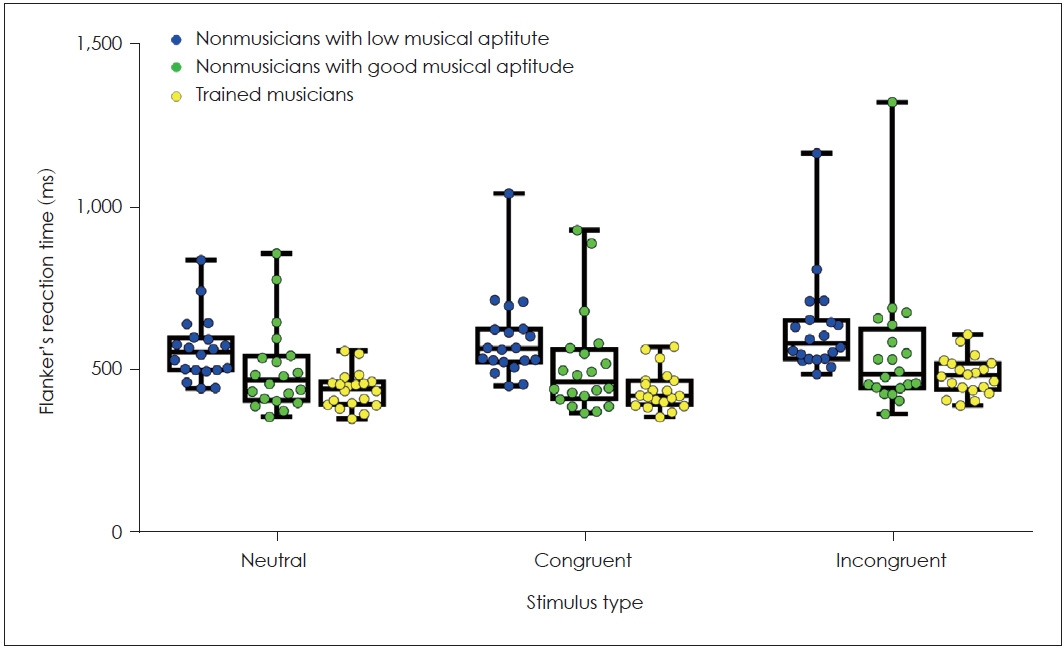
Reaction time measured for neutral, congruent, and incongruent stimuli in Flanker’s test across groups.
Results of one-way repeated measure ANOVA (with groups as across group factor and conditions as fixed factor) showed main effect of group [F(2,57)=0.79, p<0.001, ηp2=0.99] and condition [F(2,114)=9.38, p<0.001, ηp2=0.14]. However, no significant interactions were found between condition and group [F(2,114)=2.20, p=0.07]. Results of one-way ANOVA conducted for Flanker’s reaction time measure for each condition separately, revealed main effect of group for of all 3 stimulus conditions: congruent [F(2,57)=7.98, p=0.001]; incongruent [F(2,57)=4.53, p=0.02]; and neutral [F(2,57)=7.82, p=0.001]. On the post-hoc Bonferroni test, nonmusicians with good musical aptitude and musicians showed similar reaction time (p>0.05) for all three conditions (congruent, incongruent, and neutral) in the Flanker’s task, which was significantly faster (p<0.05) than nonmusicians with low musical aptitude.
Discussion
The study aimed to investigate the effect of musical aptitude on working memory and attention span on three groups of participants (trained musicians, nonmusicians with good musical aptitude, and nonmusicians with low musical aptitude). The strength of the study arises from the use of mini-PROMS for the classification of participants with good and low musical aptitudes. The use of mini-PROMS induced objectivity in the sub-grouping nonmusician group using perceptual musical skills across multiple domains: tonal (melody, pitch), qualitative (timbre, tuning), temporal (rhythm, rhythm-to-melody, accent, tempo), and dynamic (loudness) perception.
Although the application of mini-PROMS in the current study for sub-grouping participants was based on its good psychometric properties (high test-retest reliability, good construct, and discriminant validity [19]), the authors also pondered on the influence of attention and working memory on the sub-grouping. To delineate the influence of working memory and selective attention on music appreciation abilities in nonmusicians (with good and low musical aptitude), Pearson test of correlation was administered. This findings of this test revealed that musical aptitude did not have show any significant correlation with working memory (operation span and backward digit span) and attention (Flanker’s test) for all the three groups considered in the study. The findings from this analyses strengthens the categorization of musical aptitude based on mini-PROMS, as the test only defines groups based on musical aptitude. Subject selection using mini-PROMS does not have any relationship with working memory, and hence practically nullifies the chance of removing the normal variation in the data (working memory and attention) across the three groups. This observation finds support from the research findings of Kunert, et al. [20], who explored the relation of the mini-PROMS with a standard measure of working memory (backward digit span) and selective attention (music accuracy tasks) using discriminant validity assessment procedure. Discriminant validity determines the degree of correlation between tests measuring unrelated concepts. The results of their study showed good discriminant validity of mini-PROMS, with mini-PROMS not correlating (correlation coeffeicient, r=0.04) with backward digit span. The lack of correlation between these measures is suggestive of no influence of working memory test on mini-PROMS. Similarly, only low correlation (r=0.39) was found on selective attention tasks, suggestive of the high discriminant validity of the mini-PROMS, i.e., mini-PROMS clearly targets musical aptitude of the test participants and is not affected other unrelated factors such as working memory and selective attention. To further strengthen the sub-grouping of participants, the results of mini-PROMS were also confirmed using the musical perception ability questionnaire. The sub-grouping of participants postulates that nonmusicians with good musical aptitude will have an advantage over their low musical aptitude counterparts, while trained musicians would enjoy a double advantage (composite of innate aptitude and training).
The association of musical aptitude and training with working memory and selective attention is explored in the study, based on the sub-grouping using the above standard tests. The results of the study revealed trained musicians and nonmusicians with good musical aptitude had significantly higher backward span score and faster reaction time in Flanker’s test compared to nonmusicians with low musical aptitude. This finding of faster reaction times in the Flanker’s test and higher backward digit span score in both musicians and nonmusicians with good musical aptitude supports the advantages of musical aptitude on selective attention and working memory. The advantages of musical aptitude can be related to enhanced ability of the corresponding groups (musicians and nonmusicians with good musical aptitude) to focus and react faster in auditory working memory and visual selective attention tasks. It has been reported that musical experience through training not only augments the auditory acuity (reflected as a music-induced advantage in psychoacoustic tests [4,5] for musician group) but also seems to have an effect on the processing of other unrelated musical skills such as working memory [11] and selective attention [24]. Hansen, et al. [9] found similar effects of musical training on working memory tasks such as digit forward and backward tests. Faster reaction time in the Flanker’s task is supportive of the observations by Patston, et al. [27], who noticed that musicians have faster reaction time and balanced attention capacity. Though the musicians and nonmusicians with good musical aptitude had faster reaction time on the Flanker’s test (relative to nonmusicians with low musical aptitude), this difference was not seen in the Flanker’s accuracy scores. This finding is in support of Rodrigues, et al. [28], who found that musicians in their study had significantly earlier reaction times and similar accuracy scores compared to age and gender-matched nonmusicians in a visual memory task. The authors attribute faster reaction on selective attention to enhanced sensorimotor skills in musicians. However, the similar accuracy scores in Flanker’s tasks in all three groups is indicative of the deployment of equivocal cognitive resources involved in visual pattern recognition. Also, it worth explaining that the benefits derived from musical aptitude on auditory working memory task (backward span) would have cross-modally transferred to visual domain as evidenced from faster reaction time on Flanker’s task (selective attention).
The similarity in performance of the nonmusician with good musical aptitude and true-musicians in visual attention (Flanker’s reaction musician) and auditory working memory tasks (backward digit span) may be due to intrinsic divergences unrelated to formal training. The researchers involved in this study did ponder over the possibility that differences between two groups of nonmusicians with good and low musical aptitudes on working memory tasks might be formed due to lack of motivation and seriousness or other factors like fatigue at the time of data collection. A group with poor performance in all tests could have been formed just by a certain number of people having a cavalier attitude towards the experiment. A-Test [21] was administered at the beginning of each test session to control these factors and checks on the vigilance levels in the participants. In addition, the duration of the tests lasted only for a short time (8-12 min), which falls well within the optimum limit of attention span [29]. Although the motivation level was controlled, the use of A-Test does not directly reflect group differences in the mental abilities (intelligence quotient: IQ) of three groups, which can affect working memory. Even though the presence of cognitive deficits is ruled out in the case history of the study through a structured interview, the readers are cautioned to generalize the findings after considering group equivalency in the mental abilities i.e., after an IQ test.
In the current study though backward digit span and operational span tested working memory, the group differences were only found for the backward digit span and were absent for the operational span. These findings can be correlated with different processes that underlay working memory in adults. The operational span taps on resource sharing and task switching mechanisms, while backward digit span is more of a central executive function [30]. Thus the study confirms the role of musical aptitude in the regulation of more central mechanisms involved in cognitive tasks. However, the task switching mechanisms of cognitive processing are relatively unaffected by musical aptitude.
The results of discriminant function analysis further complimented group segregation on working memory tasks (backward digit span and Flanker’s reaction time). The nonmusicians with good musical aptitude were categorized into the same cluster as the true-musicians, both of whom were segregated from the nonmusicians with low musical aptitude. This indicates that musicality can be untrained and could be innate and instinctive in nature. This categorization of innateness in music perception becomes a decisive factor in subject inclusion as controls for any study on musical training, as otherwise, the test scores would be skewed due to inherent musical advantage in nonmusicians with appreciable musical aptitude.
The present study concludes that untrained musicians with good musical aptitude can have enhanced perception in auditory working memory and visual selective attention tasks in harmony with musicians. The study finding highlights the need to exercise caution towards the assessment of musical aptitude in untrained musicians prior to their inclusion in tasks related to working memory and attention.
Acknowledgements
We would like to thank the Director and HOD, Audiology (All India Institute of Speech and Hearing, Mysuru, affiliated to the University of Mysuru) for permitting us to carry out the study. The authors like to thank all the participants of the study for their consent and cooperation during the data collection. This work did not receive any funding or grants.
Notes
Conflicts of interest
The authors have no financial conflicts of interest.
Author Contributions
Conceptualization: Kavassery Venkateswaran Nisha, Devi Neelamegarajan. Data curation: Nishant N. Nayagam. Formal analysis: Kavassery Venkateswaran Nisha. Investigation: Nishant N. Nayagam, Jim Saroj Winston, Sam Publius Anil. Methodology: Kavassery Venkateswaran Nisha, Devi Neelamegarajan. Project administration: Nishant N. Nayagam, Jim Saroj Winston, Sam Publius Anil. Resources: Jim Saroj Winston, Sam Publius Anil. Software: Jim Saroj Winston, Sam Publius Anil. Supervision: Kavassery Venkateswaran Nisha, Devi Neelamegarajan. Validation: Kavassery Venkateswaran Nisha, Devi Neelamegarajan. Visualization: Kavassery Venkateswaran Nisha, Jim Saroj Winston. Writing—original draft: Kavassery Venkateswaran Nisha, Devi Neelamegarajan, Jim Saroj Winston, Sam Publius Anil. Writing—review & editing: Kavassery Venkateswaran Nisha, Devi Neelamegarajan. Approval of final manuscript: all authors.