


Introduction
The graviceptive otolith organs sense the direction of gravity, which is important for maintaining balance and postural control. Subjective visual horizontal (SVH) and subjective visual vertical (SVV) are valuable clinical tests to measure the otolith function, which can be compromised in patients with peripheral and central vestibular disorders [1-3]. In these assessments, a certain patient is required to position a visual image (e.g., solid line) until it is perceived as the ŌĆśtrueŌĆÖ horizontal (for SVH) or ŌĆśtrueŌĆÖ vertical (for SVV) position in the absence of any visual reference. Generally, deviations of more than ┬▒2┬░ are considered pathological [1,2,4].
The visual perception of horizontality or verticality can be affected by several factors including the type of visual image employed [5,6]. The use of a more complex visual image may have the potential in improving the diagnostic value of this assessment [6]. Aside from the typical solid line image, the perception of horizontality has also been studied for dot images [3,5]. Based on the limited literature, relative to the solid line, more errors in the horizontality perception could be produced when aligning the position of dots [5].
Apart from having good diagnostic abilities, it is also clinically essential for a particular test to be stable and reliable over time. Generally, the test-retest reliability of SVV was found to be good [7-9]. On the contrary, the literature on the test-retest reliability of SVH is currently limited, particularly when tested with different types of visual images. Essentially, in this paper, the test-retest reliability of SVH for solid and dotted line images was studied.
Subjects and Methods
In this repeated measures study, 36 young Malaysian adults (mean age=23.3┬▒2.3 years, 17 males and 19 females) were enrolled. They were selected randomly among students and staff members of the respective institution. All of them were healthy and had no history of hearing, vestibular, balance, or vision problems. Hence, they performed normally in pure tone audiometry, visual acuity test, Dix-Hallpike test, and head thrust test. As well as in evaluating vestibular disorders, the associated symptoms of autonomic arousal and somatosensation using the Malay version of the Vertigo Symptom Scale [10]. All participants provided informed consent for inclusion in the study.
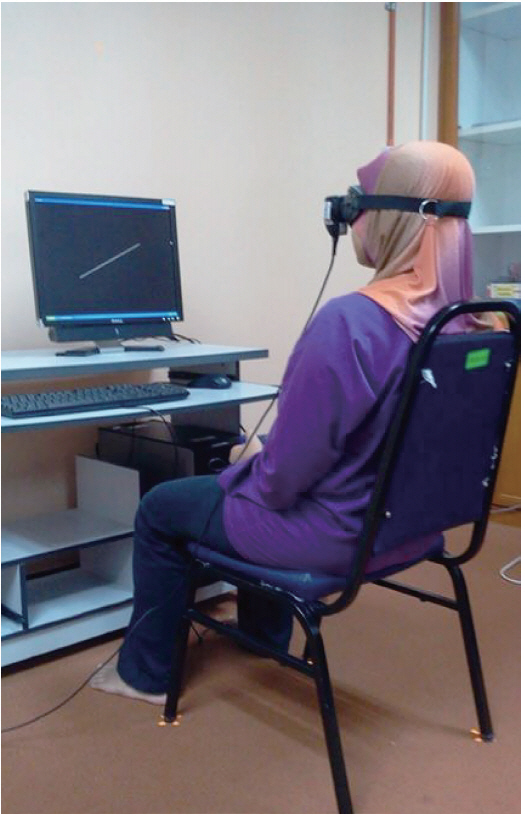
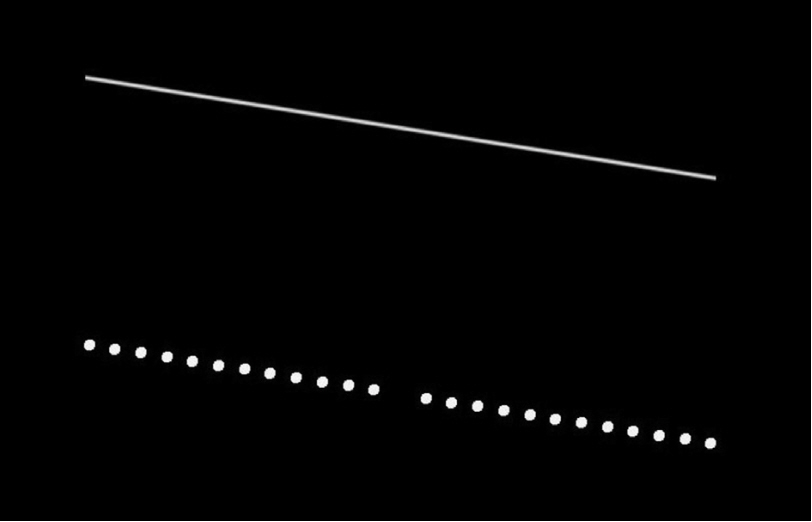
The study procedure was approved by the Institutional Review Board of the Human Research Ethics Committee of Universiti Sains Malaysia (USM/JEPeM, 16050182) in accordance with the 1975 Declaration of Helsinki and its later amendments. The SVH testing was performed in an upright body position using a computerized device (version 1.3.0 by Synapsys, Marseille, France) and took place in Otorhinolaryngology Clinic, University Hospital of Universiti Sains Malaysia. While wearing a vision field mask (to eliminate visual references) and facing the computer monitor, the participant was instructed to place the visual image precisely in a horizontal position with a control joystick (Fig. 1). The distance between the participant and the computer monitor was 1 meter. Two visual images were tested (solid and dotted lines) in the presence of a static black background (Fig. 2). The starting position of the visual image was randomized before each trial. For each visual image, six consecutive trials were conducted (three clockwise and three counterclockwise directions), and the results were averaged. Deviations to the right were recorded as positive values, and deviations to the left were recorded as negative values. After 1 week, the SVH procedure was repeated among all participants.
The mean, standard deviation (SD), and 90% range (5- 95% percentile) for SVH results were computed for each participant. Since the data were found to be normally distributed (p>0.05 by Kolmogorov-Smirnov test), parametric analyses could be performed. Paired t-test and intraclass correlation (ICC, with 2-way mixed effects model) were used to determine the reliability of SVH when tested over time for each visual image. The ICC values were interpreted as follows: excellent (>0.90), good (0.75-0.90), moderate (0.50-0.75), and poor (<0.50) [11]. The paired t-test was also used to compare the SVH results between the two visual images. To measure the agreement of SVH between the two sessions, the Bland-Altman plot was used [12]. To analyze the errors in this agreement plot, several statistical analyses were performed. Hence, one sample t-test was performed to verify the presence of a systematic error (the hypothesized mean value was set as 0). In this regard, the insignificant p value would suggest the absence of any systematic error in the plot [13]. To determine the occurrence of a proportional error, linear regression analysis was used. The absence of the proportional error was indicated by the insignificant p value [13]. p<0.05 was considered statistically significant.
Results
Table 1 shows the mean, SD, and 90% range of SVH for solid and dotted line images in both sessions. For each session, the paired t-test revealed no significant difference in SVH angle between the solid and dotted lines (p>0.05). Similarly, for each visual image, no significant difference in SVH result was found between session 1 and session 2 (p>0.05). Both solid and dotted lines produced high ICC values, indicating good test-retest reliability.
Fig. 3 shows the Bland-Altman agreement plot for each visual image. As revealed, for both visual images, most of the data fell within the limits of agreement (LoA), and the number of outliers was minimum. Furthermore, when the predefined clinical criteria were set at ┬▒2┬░, all the data were in fact included in this range, indicating good agreement of SVH results between the two sessions for both visual images. It is worth noting that the solid line revealed a smaller width of LoA (-1.38-1.48) than the dotted line (-1.83-1.82). The good agreement of SVH data between the sessions for both visual images was further supported by the error analyses. In particular, the systematic error was insignificant for both solid [p=0.699; 95% confidence interval (CI), -0.199-0.294] and dotted (p=0.972; 95% CI, -0.321-0.310) line images. The linear regression analysis revealed the absence of a proportional error for both visual images (p>0.05).
Discussion
In the present study, the test-retest reliability of SVH was determined by measuring its correlation and agreement when tested in two different sessions. As reported elsewhere, highly correlated results may not indicate that they highly agree with each other [12,13]. As such, correlation results should be further ascertained with agreement analyses to have a better view of the test-retest reliability of a particular tool [12,13].
When the mean SVH data between the solid and dotted lines were compared, the results were not statistically significant. In contrast, in a study by Docherty and Bagust [5], the dots produced more errors than the solid line. The disagreement between the results is possibly due to the methodological differences in both studies. Different from the present study, Docherty and Bagust [5] recorded SVH using different dot images, and a frame was included as part of the visual image.
Although the solid line produced slightly better results than the dotted line, both visual images showed good test-retest reliability (based on ICC values), and the agreements between the two sessions were within the clinically accepted range (┬▒2┬░). In a study by Tribukait, et al. [14], SVH angles were successfully recorded from 72 healthy adults in the upright and several body tilt positions. In total darkness, they were required to indicate the perception of horizontality by adjusting the position of a narrow light bar. In the test-retest study, only 24 participants were involved (the gap between the first and second sessions was 1-14 days). However, the study outcomes were only analyzed descriptively, and the strength of reliability was not determined. Nevertheless, consistent with the agreement results in the present study, they found that 96% of the participants showed stable SVH results (i.e., the results did not differ by more than 1.2┬░ between sessions).
The visual perception of verticality has also been found to be repeatable when assessed over time among healthy adults [7-9]. Tesio, et al. [8] recorded SVV angles from the junior (aged 23-43 years) and senior (aged 44-58 years) groups. As reported, the test-retest reliability of SVV was found to be good for the junior group (ICC=0.84). In contrast, the test-retest reliability of SVV was poor for the senior group (ICC=0.48), implying a notable age effect on the temporal reliability of SVV testing [8]. In this regard, further research involving older adults is required to determine if a similar pattern would be revealed in the SVH testing.The visual perception of verticality has also been found to be repeatable when assessed over time among healthy adults [7-9]. Tesio, et al. [8] recorded SVV angles from the junior (aged 23-43 years) and senior (aged 44-58 years) groups. As reported, the test-retest reliability of SVV was found to be good for the junior group (ICC=0.84). In contrast, the test-retest reliability of SVV was poor for the senior group (ICC=0.48), implying a notable age effect on the temporal reliability of SVV testing [8]. In this regard, further research involving older adults is required to determine if a similar pattern would be revealed in the SVH testing.The visual perception of verticality has also been found to be repeatable when assessed over time among healthy adults [7-9]. Tesio, et al. [8] recorded SVV angles from the junior (aged 23-43 years) and senior (aged 44-58 years) groups. As reported, the test-retest reliability of SVV was found to be good for the junior group (ICC=0.84). In contrast, the test-retest reliability of SVV was poor for the senior group (ICC=0.48), implying a notable age effect on the temporal reliability of SVV testing [8]. In this regard, further research involving older adults is required to determine if a similar pattern would be revealed in the SVH testing.
The present study has several limitations. First, the sample size used was modest (n=36), and conducting further largescale studies can be beneficial to support the present study findings. Second, the test-retest results of SVH provided by the present study may only be applicable to young adults. Hence, studies on the test-retest reliability of SVH should be conducted among other age groups. Third, the SVH angles were only recorded in the static upright body position. The literature on the reliability aspect of SVH can be expanded by studying SVH outcomes in the dynamic or different body tilt positions. Finally, the commonly used angle deviation range (┬▒2┬░) was used to study the test-retest reliability of SVH testing. However, this range may not be entirely appropriate to be used in all situations. In this regard, future research involving normal and pathological subjects should be performed to determine the most optimum cutoff value for SVH testing (using solid and dotted line images). Subsequently, the test-retest reliability of SVH can be further tested using the ŌĆśnewŌĆÖ angle deviation range.
The present study was the first to report the test-retest reliability of SVH when tested with different visual images. Based on the correlation and agreement results, SVH testing was found to be temporally reliable, which can be clinically beneficial. Both solid and dotted line images are reliable to be used in SVH testing involving young adults. In particular, due to its good reliability, it can be used conveniently (in conjunction with other vestibular tests) to document the improvements in vestibular symptoms following dedicated treatment or rehabilitation methods among patients with vestibular disorders. Nevertheless, future studies are required to further support the present study findings.