


Introduction
All activities required for perception and recognition of the various auditory and visual stimuli depend on the accurate discovery of events [1]. Each of the senses in the body can work together, in addition to acting alone, and their combination can help a person in discovering what has happened more accurately and comprehensively [2]. In the auditory system, the sound is delivered through the cochlea to the auditory nerve, and the auditory signal eventually reaches the surface of the auditory cortex. Thus, the person recognizes the acoustic stimulus [3]. Interaction between the auditory and visual senses is one of the multisensory interactions in humans. In this situation, information from the auditory and visual systems is combined in the occipital, temporal, frontal, and parietal cortex, which might change the essential nature of both visual and auditory stimuli [4]. For example, according to the McGurk effect, combined information from the auditory and visual systems influences speech perception. If the auditory /ba/ and visual /ga/ stimuli are presented simultaneously, the person will eventually hear /da/ [2]. This phenomenon is considered a comprehensive example of how auditory and visual information integrate at the upper levels of auditory and visual processing [5]. Shams, et al. [6] introduced the sound-induced flash illusion (SIFI) phenomenon. In this phenomenon, acoustic stimulation has an influence on the perception of visual stimuli. In the SIFI test, naive volunteers are presented with a flash stimulus, and they are simultaneously provided with an audio stimulus so that the naive volunteers only see one flash. Nevertheless, when a flash is presented during two audio stimuli, the naive volunteers would admit that they see two flashes [6]. It has been stated that the visual illusion can be caused by the presentation of acoustic stimuli.
This illusion indicates the integration of visual and auditory information at the upper levels of the auditory and visual cortex [7]. Studies have shown that SIFI is not influenced by the frequency of stimuli [6] and feedback training [8]. Therefore, this phenomenon has been proven to result from the modulation of activity on the surfaces of the visual cortex and superior temporal gyrus such that neuroimaging techniques such as functional magnetic resonance imaging have confirmed increased activity in the visual cortex during the occurrence of SIFI [9]. All of the studies in this field have conducted the SIFI test in individuals with normal hearing [6]. However, a study assessing SIFI in patients with hearing loss problems has not been conducted yet. In a person with hearing impairment, the amount of input voice decreases, resulting to a decrease in the neural firing rate and neural transmission time [10]. Hearing aids are prescribed depending on the degree of hearing loss, and with the use of the hearing aid, patients with hearing impairment will be able to hear voices previously deprived of them. However, the deleterious effects of hearing aid digital delay depend on the degrees of hearing loss [11]. The temporal association between auditory and visual stimuli is a significantly important factor in encoding the integration between the auditory and visual stimuli [12]. Auditory and visual stimuli can be integrated together up to 100 ms of time window. If the time window increases, auditory, and visual stimuli cannot be combined, and the brain processes auditory and visual stimuli separately [13,14]. Hearing loss and hearing aid digital delay can influence the time window and auditory and visual integration [15]. Accordingly, the present study aimed to investigate and analyze the effects of different degrees of hearing loss and hearing aid digital delay on the SIFI test results.
Subjects and Methods
Participants
All the participants were recruited from the Najva Audiology Clinic. The participants were divided into three groups including the following: 13 volunteers (seven females and six males, with a mean age of 33.77 years) with normal hearing in both ears (Group 1), 13 volunteers (five females and eight males, with a mean age of 45.77 years) with bilateral symmetrical mild to moderate sensorineural hearing loss (Group 2), and 13 volunteers (six females and seven males, with a mean age of 43.54 years) with bilateral symmetrical moderate to severe sensorineural hearing loss (Group 3). Each of the participants in Groups 2 and 3 had at least 6 months of hearing aid experience [16]. All of the participants had normal or corrected-to-normal vision in normal range [17] and had no history of mental disorders or brain diseases [1] and middle ear infection [18].
Table 1 shows the mean hearing threshold at frequencies of 500, 1,000, 2,000, and 4,000 Hz for the right and left ears, with respect to sex and age of the participants in the normal hearing group. Moreover, Table 2 and 3 present the mean hearing threshold and aided hearing threshold at frequencies of 500, 1,000, 2,000, and 4,000 Hz for the right and left ears, with respect to sex, age, duration of wearing the hearing aids, and hearing aid brands of the participants in Groups 2 and 3, respectively.
Before starting the study, all of the participants were reexamined to assess their hearing and visual thresholds by repeating the hearing test at a frequency of 250-8,000 Hz. Moreover, the aided hearing thresholds were assessed for the participants in Groups 2 and 3 to accurately assess their normal hearing threshold using the hearing aid. The vision of the participants was also assessed using the Snellen eye chart to appropriately evaluate their normal vision [17]. An informed written consent was obtained from the participants. The study was approved by the Human Research Ethics Committee of Tehran University of Medical Sciences (IR.TUMS. FNM.REC.1398.139), and it was conducted in accordance with the Declaration of Helsinki (1975) and its later amendments.
Experimental procedure
In performing the SIFI test, all the required parameters and points for test design using the MATLAB software (R2019b, MathWorks, Natick, MA, USA) were selected according to Shams, et al. [6]. The frequency of beep was equal to 3,500 Hz with 7 ms of duration at 95 dB sound pressure level (SPL) provided by the two speakers, one speaker on each side of the monitor, and the two speakers were placed 58 cm apart. The time interval between the beeps was equal to 57 ms, and the beeps were always provided 23 ms before the flashes. Flashes were presented with 17 ms of duration and 108 cd/m² of luminance at a 2-degree angle of 5 degrees of visual field eccentricity on a 0.02 cd/m2 luminaire black plate. Furthermore, the time interval between the flash presentations was equal to 50 ms. During the test, the participants were instructed to sit on a 60-cm chair away from the laptop monitor (model ASUS X550, Taipei, Taiwan) and to focus on the screen continuously to count the number of flashes. The test was performed in a dome-lighted room and acoustic environment with 42 dB of background noise [17]. Participants were instructed to turn off their cell phones in the test room. Frequency and intensity were checked using the sound level meter (Bruel & Kjaer, 2235 manual; https://www.bksv.com/en/products/sound-and-vibration-meters/ sound-level-meters-and-vibration-meters). In the single flash test, a flash was provided with 0-4 beeps, and in multiple flash test, 1-4 flashes were provided with 0-1 beeps. Each of these tests was randomly performed 5 times by the participants, and a total of 65 trials were performed. All the tests were performed in the three study groups, and the data were analyzed.
Statistical analyses
Data analysis was performed using the Statistical Package for the Social Sciences version 22 software (SPSS, New York, NY, USA). Normality of data was evaluated using the Kolmogorov-Smirnov test. Analysis of variance (ANOVA) was used to compare the mean flash illusion between the three study groups, and if the ANOVA results were significant, the Tukey’s post-hoc test was used for pairwise comparison. A p-value of 0.05 was considered statistically significant.
Results
According to the results, the participants saw one flash in all the study groups while a flash was presented with 0-1 beeps (Trial 1). Therefore, when the number of beeps increased up to 2-4 (Trial 2), the number of perceived flashes observed by the participants in all the study groups increased, although only one flash was presented. There was a statistically significant difference between the two trials (p<0.001) in all the study groups, which was referred to as visual illusion.
Nevertheless, there was no statistically significant difference between the study groups (p=0.999). Fig. 1 shows the mean number of perceived flashes for one flash and 0-4 beeps provided for all the studied participants.
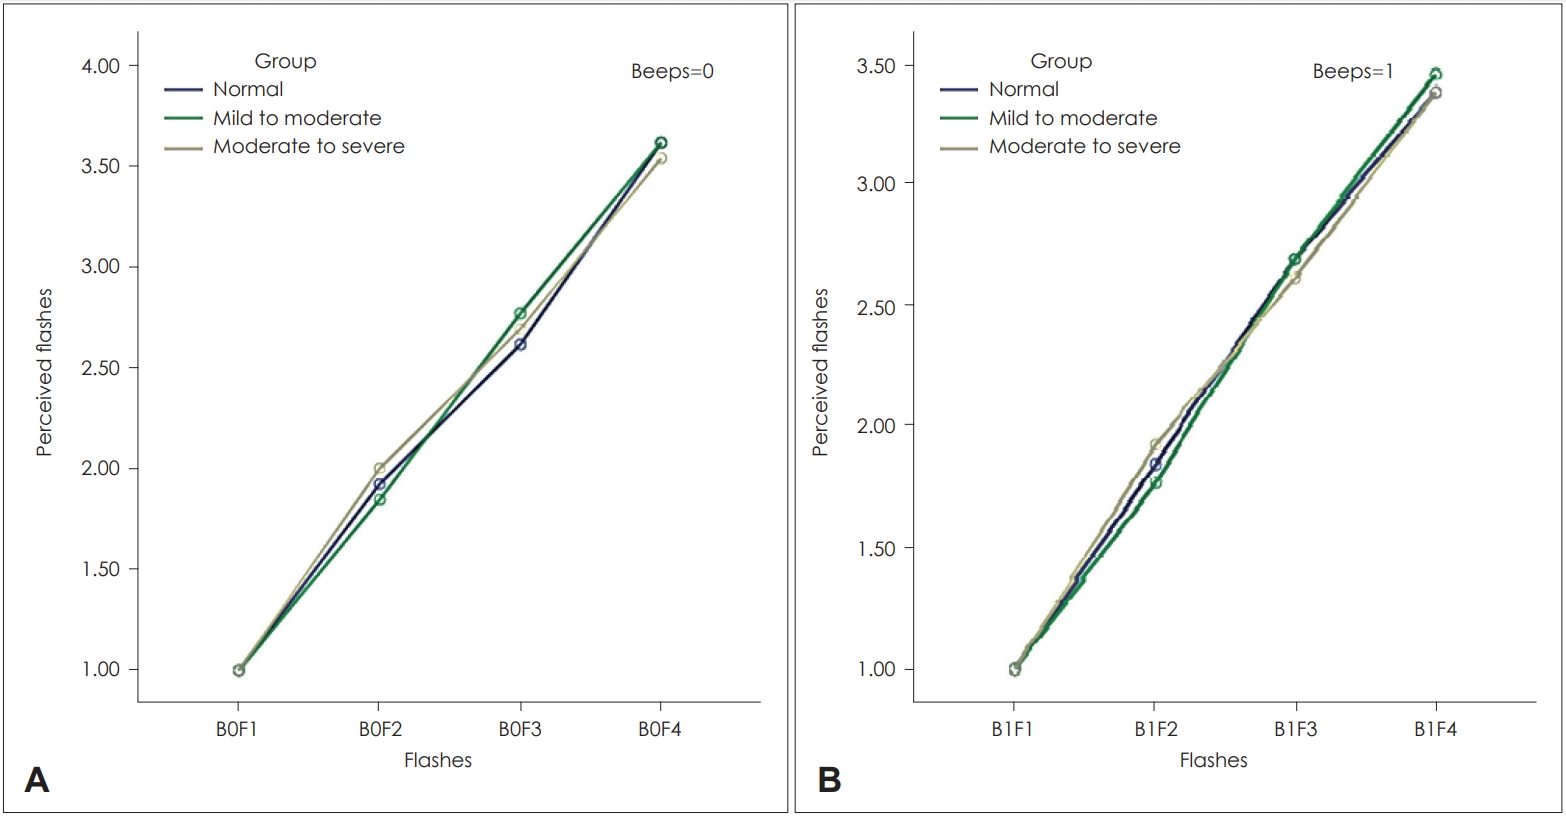
In the multiple flash test, only the number of flashes increased, and the number of beeps remained constant. These results are contrary to those of the single flash test, and perceived flashes demonstrated that the participants could distinguish the correct number of flashes when the number of beeps remained constant. Fig. 2 shows the results of the multiple flash test. Fig. 2A shows the mean number of perceived flashes when no beeps were presented, and the number of flashes varied (from 1 to 4). Fig. 2B shows the mean number of perceived flashes when one beep was presented, and the number of flashes varied (from 1 to 4).
The mean number of perceived flashes in the multiple flash test was similar in Fig. 2A and B, and the mean number of perceived flashes increased in all the three groups by increasing the number of flashes as shown in Fig. 2A. There was no statistically significant difference between the two groups (p=0.836). Moreover, the mean number of perceived flashes increased in all the three groups by increasing the number of flashes as shown in Fig. 2B. There was no statistically significant difference between the two groups (p=0.937).
The responses of the participants in the multiple flash test were contrary to the number of beeps, which they heard in the single flash test, since it can be certainly confirmed that the responses in the single flash test were based on visual perception and were not influenced by the auditory cognitive biases.
Discussion
This study was conducted to investigate the effects of different degrees of hearing loss on the SIFI test results; however, all of the previous studies have conducted the SIFI test in individuals with normal hearing. Herein, the effects of digital hearing aid digital delay were also investigated on the temporal coincidence between auditory and visual signals. Temporal coincidence is one of the most important factors contributing to the integration of auditory and visual information in the temporal and occipital cortex [19]. When two sensory stimuli are presented, a specific window is defined for the input of these two systems [14]. However, if the time between the two stimuli exceeds, then the input cannot be integrated. Finally, each sensory stimulus just reaches its own cortical region, and sensory stimuli will not be perceived as multisensory signal [20]. The window defined for the integration of the auditory and visual sensory inputs is less than 100 ms of duration [13,14]. Nevertheless, if the interval between these two stimuli is greater than 100 ms, then the audiovisual multisensory integration will not occur [20]. The sensitivity of cochlear hair cells decreases for soft sound in the hearing-impaired patients; therefore, transmission of the sound from the peripheral hearing system to the central system is delayed [21]. However, when the hearing aid is prescribed based on the severity of hearing loss, the sound is amplified, and this delay is compensated for the peripheral hearing system [22]. The temporal processing between visual and auditory stimuli has different velocities in the peripheral and central systems [23]. The speed of light sensory receptors in the eye is faster than that of sound sensory receptors in the cochlear; in contrast, the speed of sound is faster than the light when the input is transferred from the peripheral to the central system [23]. Therefore, any factor reducing the transmission rate of auditory or visual input can highly influence the multisensory processing [24]. Hearing loss leads to the reduction of the speed of auditory stimuli, which in turn causes a delay in transmission of the sound from the peripheral auditory system to the central auditory system [25]. Hence, the auditory and visual stimuli cannot be integrated [26]. If the hearing aid is prescribed, this delay is minimized due to the appropriate amplification applied at different frequencies. The results of this study showed no significant difference in the visual-auditory integration between the hearing aid users and participants with normal hearing.
Furthermore, when disturbance occurs in the auditory and visual sensory systems, the central processing system minimizes the delays by making certain changes, but if the central system itself is influenced, it cannot aid in reintegrating the auditory and visual inputs, which is observed in schizophrenic patients [17]. Humes, et al. [26] reported that the temporal discrimination threshold will be increased with increasing age. Diederich, et al. [27] showed that aging causes the temporal window of sensory input integration to become longer. It seems that, with the decrease in the sensitivity of the peripheral sensory system, the central system changes the central system’s processing to protect the multisensory information and to provide the conditions for the integration of multisensory information [1].
As mentioned earlier, the transmission rate of auditory input decreases in the hearing-impaired patients, making it difficult to integrate the auditory and visual sensory inputs. However, the transmission rate of auditory input will be closer to that of the participants with normal hearing, and the integration of auditory and visual inputs will occur with the use of the hearing aid. The delay in digital hearing aid circuit is the second factor influencing the auditory temporal processing in the hearing aid users [11,28]. When the hearing aid microphone receives the sound, the sound is converted into digital codes and is delivered in the hearing aid sound processor. At this stage, various processes such as noise reduction and speech signal amplification are applied, and the final information is sent to the hearing aid receiver. At this point, the receiver converts the digital codes into amplified audio signals and sends them to the ear canal, and finally, the patient can hear the amplified sound [11]. Previous studies have shown that the sound encounters a slight delay when it enters the microphone until reaching the receiver depending on the processing algorithm of the hearing aid [29]. Eric Lupo, et al. [21] reported that the delay in hearing aid circuit is insufficient to impair the integration of auditory and visual inputs. Thus, it can be concluded that different degrees of hearing loss and digital hearing aid digital delay cannot influence the integration of auditory and visual multisensory information.
In conclusion, the findings of the study indicated that hearing loss and digital hearing aid digital delay cannot influence the SIFI phenomenon. In the present study, participants with asymmetric and unilateral hearing loss were not evaluated, which can be considered as one of the limitations of the study. Rohlfs, et al. [30] stated that the unilateral and asymmetric hearing loss results in the deactivation of the neural encoding during audio-visual integration. Therefore, conducting the SIFI test in patients with asymmetric and unilateral hearing loss is recommended.