


Introduction
Otoacoustic emissions (OAEs) are low-intensity sounds generated by the cochlea, and they are commonly associated with the function of the outer hair cells (OHCs) [1]. Depending on their etiology, OAEs can be classified into spontaneous and evoked. Evoked OAEs can be elicited by a single pure tone (stimulus frequency OAEs), by short-lasting clicks or tonepips (transient OAEs; TEOAEs), or by a pair of pure tones presented simultaneously (so called distortion-product OAEs; DPOAEs) [2].
In clinical practice, DPOAEs and TEOAEs are the most used to assess the OHCs function [3]. While the most typical OAE application is newborn screening; OAEs can also be used for the differential diagnosis of hearing loss, and for monitoring potential or progressive hearing-impairment conditions such as ototoxicity or noise-induced hearing loss [3]. Since DPOAEs can be measured at a broader range of frequencies than TEOAEs (e.g., >4 kHz), they are better suited for studying the pathologies where high frequencies are compromised (e.g., ototoxicity).
DPOAE measurements are considered objective and noninvasive, as they do not require patients to respond actively to the presented stimuli. Further, an ongoing advance in available technology (hardware and software) enables measuring OAEs in an increasingly large group of patients.
The DPOAEs are elicited by two pure tones (so-called primary tones) with frequencies f1 and f2, where f1<f2. In response to this stimulation, the cochlea generates additional signals or distortions at frequencies arithmetically related to those of the stimulus tones [3], and these distortion tones are referred to as the DPOAEs. DPOAE magnitude depends on several parameters of the two evoking tones, i.e., frequency separation (f2/f1), presentation levels (L1, L2), and level difference (L1-L2) [2].
For diagnostic purposes, the DPOAE magnitude can be represented as DP-gram (DPOAE level as a function of f2, with the primary-tone levels kept constant) [2]. The DP-gram can be used to assess the background noise, the presence of distortion products (DPs) above the noise floor and the DP response reliability. This information assists the clinician in determining whether DP amplitudes are normal, abnormal, or absent [3].
While a large part of the research has been focused on optimizing the stimulus parameters and test protocols for various listener groups [4], less attention has been paid to investigating differences in the performance of the clinically available measurement systems and protocols [3,4]. Although devices can use similar recording parameters, differences in hardware (e.g., microphone and speakers) might impact measurements. Specifically, while some studies have shown comparable results for different OAE-screening systems [5], limited information is available on clinical devices using diagnostic settings.
Additionally, it is not uncommon for clinicians to face some difficulties when OAEs are being used to assess auditory function, e.g., due to differences between measurement protocols and devices. Protocols may vary in terms of incorporating higher frequencies (e.g., >6,000 Hz) and different devices may offer different measurement quality at these frequencies. Additionally, while the use of DPOAEs in the middle frequencies (e.g., 1,500 Hz to 3,000 Hz) range has been widely reported and described; less information is available about the use of DPOAEs to assess high frequencies (>6,000 Hz) with available clinical devices.
Further, even different devices or models from the same manufacturer may differ in terms of measurement performance. Since normative performance data for the devices is not publicly available, clinicians are unaware of possible differences between devices, even those from the same manufacturer, which may result in suboptimal interpretation of results.
Since high data quality is essential for a precise diagnosis of hearing impairments, the current study compares two commercial clinical devices—Titan and Eclipse (selected for high comparability), which have differences in hardware using a similar recording protocol and collects normative data for DPOAEs from normal-hearing listeners.
Subjects and Methods
Participants
Seventy-four young adults were recruited for this study from the University of Southern Denmark and the Technical University of Denmark (age: 23.6±1.6 years, range 18–26 years; 32 males). All participants were assessed for meeting the following inclusion criteria: 1) pure tone thresholds ≤20 dB HL (at 0.25, 0.5, 1, 2, 4, 6, and 8 kHz); 2) normal middle ear status (type A tympanograms and presence of acoustic reflexes at 1 kHz and 2 kHz); and 3) normal otoscopy. The study was approved by the Science-Ethics Committee for the Capital Region of Denmark (reference H-16036391) and the Research & Innovation Organization Board of the University of Southern Denmark. Written informed consent has been obtained from all participants.
Eleven participants were excluded from the study, since they did not meet the inclusion criteria or due to technical issues during the assessment. Therefore, 63 participants conformed to the final sample (age: 23.2±2.0 years, range 18–26 years; 36 males). The distribution of pure-tone averages measured for four frequencies (0.5, 1, 2, and 4 kHz) had a mean of 2.5 dB HL (SD, 3.2 dB) for the right ears and the mean of 2.2 dB HL (SD, 3.4 dB) for the left ears.
Measurement procedure
The audiological-assessment comprised several steps. First, otoscopy was performed by the examiners to check the ear canal and tympanic membrane. Pure-tone thresholds were measured next, at octave frequencies (0.25–8 kHz), using AC40 and Affinity 2.0 audiometers (Interacoustics A/S, Middelfart, Denmark). Normal hearing was defined as pure-tone thresholds ≤20 dB HL in both ears (0.25–8 kHz). The middle ear status was assessed by measuring wideband tympanometry and ipsilateral acoustic reflex measurements at 1 kHz and 2 kHz using a Titan tympanometer (Interacoustics A/S, Middelfart, Denmark). Normal middle-ear function was defined as a detectable acoustic reflex, and peak compliance, peak pressure, gradient, and ear canal volumes within normal ranges for adults [6].
The DPOAE test was conducted in a sound-treated booth using two different devices running different software. The Eclipse (E) device used the IA OAE Suite software, and the Titan (T) device used the Titan Suite Software (Interacoustics A/S). The DPOAE protocol settings were the same for Eclipse (IA OAE Suite) and Titan (Titan Suite) (Table 1).
DPOAE measurements
The stimulus levels of the primary tones were set at SPLs of 65 dB (L1) and 55 dB (L2) with a primary tone frequency ratio (f2/f1) of 1.21 (2f1-f2). These parameters were selected as they can elicit robust DPOAEs in children and adults, i.e., they can be used in different populations [3]. DPOAE f2 test frequency was measured in descending order at 31 frequencies (500, 553, 611, 675, 745, 824, 910, 1,006, 1,112, 1,228, 1,357, 1,500, 1,657, 1,831, 2,024, 2,236, 2,471, 2,730, 3,017, 3,334, 3,684, 4,071, 4,498, 4,971, 5,493, 6,070, 6,707, 7,411, 8,190, 9,050, 10,000 Hz). The assessment of the 31 frequencies took about 5 minutes per ear. For each participant both ears were tested in random order.
Probe fit was checked by visual inspection of the stimulus spectrum (broadband click stimulus). For evaluation of the recorded DPOAE responses, a minimum DP amplitude criterion was set to -10 dB SPL. The minimum signal-to-noise ratio (SNR), defined as the difference between OAE amplitude and the noise level measured at the corresponding frequency, in dB SPL, was set to +6 dB. Further, the DP tolerance (which measures the stability of the OAE level over time) was set to ±4 dB, and the DP reliability (as indicated by the recording systems) of at least 98% was required. The maximum testing time per point was set to 15 seconds, with residual noise not greater than -20 dB SPL as a stop criterion. DPOAEs’ responses that did not meet the above criteria were excluded from the analysis.
Analysis
Data were collected from 126 ears (n=63) at 31 frequencies. At some test frequencies, a large proportion of unreliable responses/missing points (with reliability ≥98% criterion) was found. Frequencies with ≥8% of missing points (i.e., present in >10 ears) were excluded from further analysis. As a result, ten of the lowest and highest frequencies were excluded, and 21 frequencies (from 828 Hz to 6,072 Hz) remained for the analysis of DPOAEs, noise levels, and SNR. Furthermore, only participants having reliable responses (no missing points) in both ears and devices within the range of the selected frequencies were included in the analysis. The final sample consisted of 74 ears (n=37).
Statistical analysis
The Shapiro–Wilk test for normality was applied to all data. Within-group comparisons were undertaken using repeated measures analysis of variance (ANOVA), with a device (Eclipse vs. Titan), test ear (right vs. left) and frequency as within-subject factors, and sex as a between-subject factor. A p-value <0.05 was considered statistically significant. Bonferroni corrections were applied to correct for multiple comparisons. The chi-square test was conducted between ears, devices, and across frequencies for missing data analysis. The Greenhouse–Geisser correction was applied to the repeated measures ANOVA, whenever Mauchly’s test indicated that the assumption of sphericity had been violated. IBM SPSS Statistics version 26.0 (IBM Corp., Armonk, NY, USA) was used for all analyses.
Results
Missing data
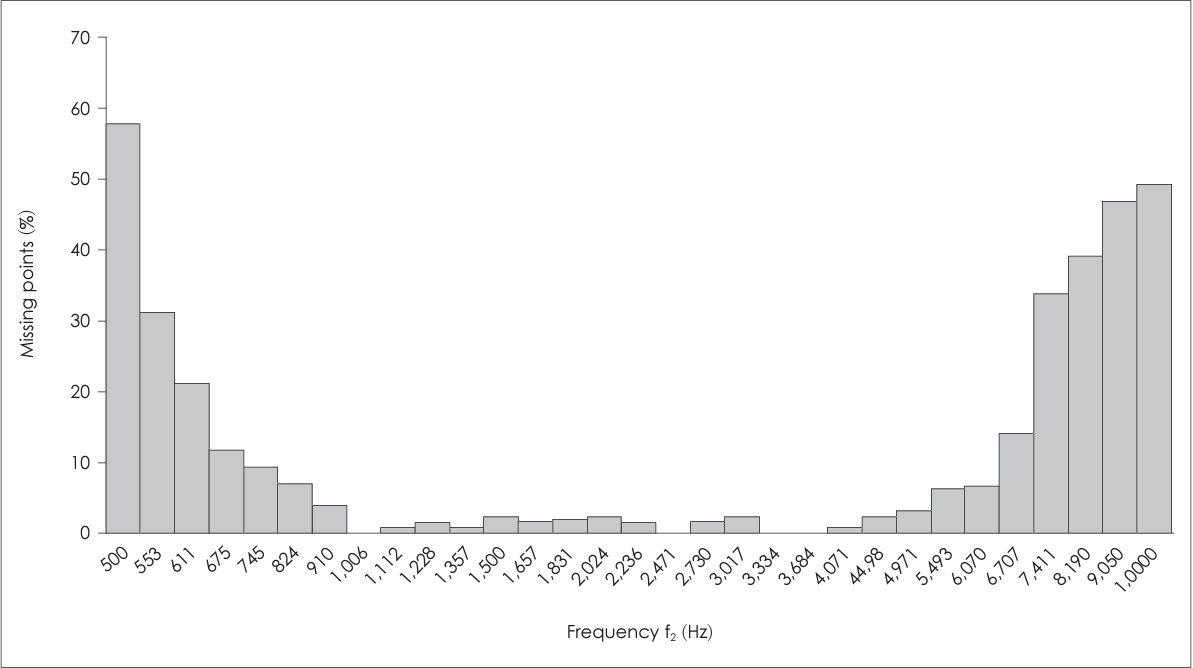
Missing data occurrence (measured in %) was analyzed in the full dataset, and no significant differences were observed between ears and devices (p>0.05). Therefore, composite scores were computed for further analyses. Fig. 1 shows that the edge frequencies evidenced the highest number of missing points. The missing data occurrence at low frequencies (<1,000 Hz) ranged from 3.9% at 910 Hz to 57.7% at 500 Hz, and at very high frequencies (>8,000 Hz) ranged from 39% at 8,190 Hz to 49.2% at 10,000 Hz. At medium frequencies (≥1,000 Hz to <4,000 Hz), the occurrence ranged from 0% at 1,006, 3,334, and 3,684 Hz to 2.4% at 3,017 Hz, and at high frequencies (≥4,000 Hz to ≤8,000 Hz) ranged from 2.4% at 4,498 Hz to 33.6% at 7,411 Hz.
DPOAE amplitudes
Three-factor (device [2 levels], ear [2 levels], and frequency [21 levels]) repeated measures ANOVAs with sex (male and female) as between-subject factors were used to investigate the differences in the recorded DPOAE levels (in dB SPL).
No significant differences between the two devices were found [F(1, 35)=2.511, p=0.122]. There was a significant main effect of frequency for DPOAE amplitudes [F(20, 700)=13.751, p<0.001, η2=0.282], where higher frequencies showed significantly lower amplitudes compared to lower frequencies (Fig. 2). There was a significant interaction between frequency and sex [F(20, 700)=1.698, p=0.029, η2=0.046], and females evidenced larger amplitudes across frequencies (>1,831 Hz) compared to males (Fig. 3). A peak in DPOAE amplitudes can be seen at approximately 1,400 Hz (mean, 13.0 dB SPL) and a minimum at approximately 6,000 Hz (mean, 6.0 dB SPL), regardless of sex (Fig. 2). A second peak can be seen at approximately 4,500 Hz but only for females with a mean amplitude equal to 10.5 dB SPL (Fig. 3).
Noise levels
Three-factor (device [2 levels], ear [2 levels], and frequency [21 levels]) repeated measures ANOVAs were used to investigate the recorded-noise levels. There were significant device and frequency main effects [F(1, 36)=480.602, p<0.001, η2=0.930; and F(20, 720)=787.910, p<0.001, η2=0.956, respectively]. Recorded noise levels were significantly lower for Titan (mean, -17.61 dB SPL) compared to Eclipse (mean, -11.15 dB SPL), regardless of frequency and ear. Further, the noise levels significantly differed across frequencies, where lower noise levels were consistently observed at high frequencies in both devices (Fig. 2). Finally, there was a significant device-frequency interaction [F(20, 720)=10.813, p<0.001, η2=0.231]. Specifically, the Titan system showed significantly lower noise levels at the high frequencies (Fig. 2).
Signal-to-noise ratio
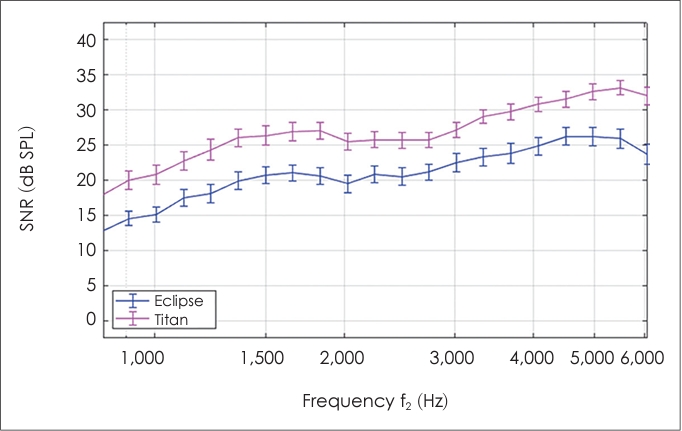
A two-factor (device [2 levels] and frequency [21 levels]) repeated measures ANOVA was used to investigate the estimated SNRs. There were significant main effects of both device [F(1, 73)= 279.874, p<0.001, η2=0.793] and frequency [F(20, 1,460)=82.311, p<0.001, η2=0.530]. SNRs were higher in Titan than in Eclipse and were increasing with frequency. Further, there was a significant interaction between frequency and device [F(20, 1,460)=3.576, p<0.001, η2=0.047], where Titan showed the largest SNR values at the highest frequencies (Fig. 4).
OAE amplitudes and noise levels for each device (i.e., normative data) are available in the Supplementary Table 1 (in the online-only Data Supplement).
Discussion
Differences between the recording systems
The main purpose of this study was to compare the DPOAEs obtained with two clinical recording systems—Titan and Eclipse (Table 1). While the results showed no differences between the systems in terms of the DPOAEs amplitudes, clear differences in terms of the measured noise levels, and thus also the estimated SNRs were found. Since the devices used the same protocol and software, the differences observed in the noise levels could be associated with differences in the type of earpiece used and internal noise in each device. Despite these differences, both devices consistently meet the pass criteria for the SNR (≥6 dB) across frequencies, and thus the test outcome (pass/reliable response) was not compromised.
However, the lower noise levels (and the resulting higher SNRs) observed in Titan suggest that this system may be more suited for use in environments with higher background-noise levels, e.g., screening purposes in non-clinical settings (e.g., schools, residency homes), or could, perhaps allow for shorter testing times.
Frequency dependence of the measurements
The results of this study showed that the recorded DPOAE amplitudes and noise levels were frequency dependent. Frequency-dependent OAE amplitudes have been shown previously [1]. Carter, et al. [7] reported that at higher frequencies (between 4–6 kHz) normal-hearing listeners showed larger amplitudes than at lower frequencies (between 1.5–4 kHz). A reduction in amplitude was also observed >3 kHz, which was related to the presence of standing waves [1,7].
The DPOAE amplitudes reported here showed a peak at approximately 1,400 Hz and a valley at approximately 6,000 Hz for both sexes, and a second peak at approximately 4,500 Hz in females only. Vinck, et al. [8] reported similar results in a sample of healthy, young adults where two peaks were described at 1,440 Hz and 4,561 Hz (sex-specific values were not reported). The small differences between the studies may be related to stimuli intensity; for example, in Carter’s study [7], higher primary-tone levels were used (70/70 dB SPL, 70/60 dB SPL) whereas Vinck’s study [8] used 70, 75, and 80 dB SPL (L1=L2).
In terms of sex differences, the present study showed that OAE amplitudes at higher frequencies (>1,831 Hz) were larger in females compared to males. However, the effect size was small and the effect is thus potentially of low relevance for the clinical use. This is consistent with previous studies that reported significant, but small sex differences for DPOAE amplitudes [9,10].
A more clinically-relevant finding of the current study is the high occurrence of missing points at the edge frequencies (<828 Hz or >6,072 Hz), in both devices. At the lower frequencies, this effect could be related to physiological or environmental noise, which is strongest below 1,500 Hz [3]. The missing points at higher frequencies (e.g., >6,072 Hz) may be due to low DPOAE amplitudes [8]. These findings are in line with previous reports where DPOAEs at 8,000 Hz were only recordable in 37.2% of ears (at 50/65 dB SPL) in normal-hearing listeners [11]. Also, Petersen, et al. [12] reported that in a group of 20 normal-hearing listeners the DPOAEs were not reliable at 8,003 Hz. Further, Ng and Mcpherson [13] reported that DPOAEs measured at 6.5 kHz and 7 kHz showed a slightly higher test-retest variability than at lower frequencies. Finally, OAE variability can be higher at 6.5 kHz and 7 kHz than at lower frequencies (<6 kHz) [13].
Another factor influencing the measurements at the edge frequencies may be the probe fit; a proper fit reduces the effect of environmental noise [14]. This can be particularly relevant for high frequencies; for example, since DPOAE amplitudes are lower for high frequencies, environmental noise could have a detrimental effect on the measured emissions. The reliability of the results obtained at higher frequencies could also be compromised by calibration artefacts (from 3 kHz to 7 kHz) [15].
Further clinical implications
Characterizing the responses in normal-hearing listeners (considering specific devices) is critical for the use of DPOAEs as a diagnostic tool in the clinical population. Since the use of DPOAEs was included into audiology clinics, many studies have reported normative data for normal-hearing listeners [7,8]. This study provides additional information that may help improve protocols used for the clinical population, in particular those focusing on specific portions of the frequency spectra.
For instance, the assessment of low frequencies <1,500 Hz might not be necessary in ototoxicity monitoring as low frequencies are not normally compromised early, and assessment of higher frequencies (2,000 Hz to ≥8,000 Hz) is typically recommended for ototoxicity monitoring and in the case of a noise-induced dysfunction [2,3]. Similarly, single frequencies (e.g., between 2,000 to 4,000/5,000 Hz) are considered more efficient for hearing screening [3]. In fact, OAEs can be measured at frequencies up to 10 kHz, but clinicians should be aware of the high probability of missing responses at these frequencies (Fig. 1) and the long testing time approximately 5 minutes for each ear.
The frequency dependence of the recorded OAE amplitudes and SNRs may have another practical implication. While in current practice only SNRs are considered for diagnostic purposes, it may be more informative to consider the stimulus frequencies and OAE amplitudes as well. For example, in the current data it was possible to meet the SNR criteria with OAEs that have an amplitude ≤0 dB SPL. While such amplitude is typically considered indicative of abnormal OHC activity [3], the current data show that at higher frequencies this value, or even a lack of a reliable response, can be considered “normal.” The lower OAE levels at higher frequencies may also lead to some limitations in identifying and interpreting the responses, especially when the SNR is low due to high noise levels. Overall, it would be appropriate for a clinician to check the amplitudes regardless of the SNR criterion being met [3].
Conclusion
While there were no significant differences between the devices in terms of recorded DPOAE amplitudes (in the 828 Hz to 6,072 Hz range), noise levels significantly differed between devices. Consequently, the obtained SNRs were frequency dependent, as higher frequencies showed larger SNRs. Significant differences were found between devices for SNRs values. Despite these differences, both devices meet the pass criteria for the SNR (≥6 dB) consistently across frequencies, and thus do not compromise the diagnostic outcomes.
Further, this study confirmed that in normal-hearing listeners DPOAE amplitudes differ across frequencies, mid-frequencies (between 1,000–1,500 Hz) showing a larger amplitude. Importantly, edge frequencies (<828 Hz and >6,072 Hz) generated a larger number of unreliable responses. Due to the frequency dependence, it may be advisable for clinicians to consider OAE amplitudes and not SNRs alone for hearing-diagnostics purposes, at least when investigating noise exposure or ototoxicity.
The data collected in the current study can provide valuable information and insights that clinicians and researchers can use to define and improve protocols according to clinical needs (e.g., protocol feasibility). Additionally, the information about the differences in performance between devices will also provide a better understanding of their suitability and the considerations that clinicians should be aware of, for example, in selecting a device to be used in a clinic.