


Introduction
Music can be defined as the art that expresses thought and feelings and can provoke strong emotional reactions and adjusting the mood. However, the enjoyment of the music is limited for the hearing amplification system (HAS) group who use the cochlear implant (CI) and/or hearing aid (HA) systems [1]. There were many findings from CI users about music perception. Although the music sounds as noisy or strange resulting disappointment, many CI users showed a desire to enjoy music and be exposed to the music frequently [2]. Music perception abilities of the CI users appeared differently from the NH group for several elements such as rhythm, pitch, melody, and timbre. For example, the CI group only preferred the simple melodies while the normal hearing (NH) group preferred the complex melodies [3]. Interestingly, CI users have shown quite good perception ability in rhythm discrimination [4,5].
There are a number of factors that affect the difference of music perception ability for the CI group. The auditory sensitivity of the NH group plays an important role in listening to the music because human auditory system recognizes and analyzes music signals based on a band-pass filter at specific points in the basilar membrane [6]. However, the electrically limited transmission system of the HAS might impede the music perception because the sound processor filter of HAS analyzes sound through wide band-pass filter which has fixed center frequency and fewer electrical channels [7]. In fact, CI and/or HA system deteriorates frequency resolution ability due to the difficulty for perceiving exact pitch and discriminating music sounds. Also, the melody and timbre perception seemed to be affected by the desensitized psychoacoustic auditory filter for HAS users [4,5].
The objective test through the auditory evoked potential and mismatch negativity (MMN) had been conducted for evaluating the music perception ability of the hearing loss (HL). The MMN revealed a difference detection process in the auditory system as an indicator of the auditory discrimination’s accuracy. When a clarinet sound was presented to the NH and CI groups with different frequencies, intensities, and durations and analyzed the ability to distinguish the difference using MMN, the CI group revealed a small MMN amplitude when compared to the NH group, showing less accurate and sensitive auditory discrimination ability [8].
There are various kinds of assessment tools that can evaluate the music perception ability such as the Musical Aptitude Profile [9], Primary Measures of Music Audiation [10], Musical Sounds in Cochlear Implants [11], University of Washington’s Clinical Assessment of Music Perception [12], Music Perception Test [13], and Music in Children with Cochlear Implants [14]. Some questionnaires that can evaluate the music perception ability are also developed like Munich Music [15], and Music USE [16].
In current study, the music perception ability of the NH and HAS groups was assessed through the Assessment of Music Perception (AMP) which was developed for evaluating pitch, melody, rhythm, timbre, and harmony perception abilities, and emotional reaction for analyzing music perception ability developed recently in Korea [17]. Besides, a Music Listening Attitudes and Satisfaction Questionnaire (MASQ) that was also developed in the same study was conducted to identify the real condition and degree of satisfaction of listening to music of the NH and HAS groups. Also, as an objective test, MMN was evaluated. In order to implement the music rehabilitation, evaluating the music perception ability for HAS users with precise test is important. The purpose of this study was to assess the music perception ability with pitch, melody, rhythm, timbre, harmony and comprehension of the music emotion expressed of the HAS users using AMP and suggesting the systematic music rehabilitation for HAS users.
Subjects and Methods
Participants
Fifteen NH adults (9 males, 6 females) and 15 HAS users (8 wearing the CI systems, 7 wearing the CI and HA systems; 6 males, 9 females) participated. In this study, HAS means a subject who wearing CI only and wearing bimodal with CI and HA. The mean age was 35.9±12.6 years (NH group: 33.1± 11.4 years; HAS group: 38.7±13.4 years). The mean threshold after wearing HAS was 35.5±18.7 dB HL in the right ear and 42.8±22.3 dB HL in the left ear. Table 1 presents more general background information for the HAS group. Four out of the 15 wearing the CI in the right ear, one out of the 15 wearing the CI in the left ear, seven wearing the bimodal and two people wearing the CI in both ears. This study protocols and contents were approved by the Institutional Review Board (IRB) of Hallym University (#IRB-2019-070). Informed consent was obtained from all participating subjects.
Procedure
All of the tests were performed in a sound-treated booth and auditory stimuli were presented using GSI 61 (Granson-Stadler, Eden Prairie, MN, USA) audiometry and headphones (TDH-50, Telephonics Corporation, Farmingdale, NY, USA). The intensity of the musical stimuli was presented at 75 dB for the NH group and 85 dB for the HAS group via a speaker in soundproof room. MMN was recorded using Bio-logic Navigator PRO ver 7.2.1 (Natus Medical Incorporated, Mundelein, IL, USA) and headphones (TDH-39, Telephonics Corporation). The following assessment materials were performed.
Procedure 1: Speech perception test
Speech audiometry was performed on both ears of 15 patients with the NH group, and in 12 right ears and 8 left ears of 15 patients with the HAS group. Speech reception threshold (SRT) was assessed after familiarization process with a sound that 30–40 dB louder than the average threshold obtained in the pure tone audiometry of the subject. Word recognition score (WRS) was measured by presenting words at most comfortable level.
Procedure 2: The AMP test
The measurement for the AMP in this study was the same as previously developed and described by Shin, et al. [17] in 2021. The AMP was consisted of six subtests—pitch, melody, rhythm, timbre, emotional reaction, and harmony perception. Pitch perception test examined the ability to distinguish a pitch using six pure tones, 262, 330, and 392 Hz as low frequency and 1,047, 1,319, and 1,568 Hz as high frequency. Melody perception test determined the ability to recognize the melody with 10 melodies without the rhythm cues which reflected familiarity of Korean music. Rhythm perception test evaluated the discrimination ability of different rhythm characteristic using five rhythm patterns which contained 4 eighth notes and 4 eighth rests. Timbre perception test examined the ability to distinguish the sound of the instruments with 10 western and 6 Korean traditional music instruments. Emotional reaction test estimated the recognition ability of the feeling of the songs using 4 bright and 4 dark emotional Korean traditional and classical songs. Harmonic test determined the ability to discriminate the consonant and dissonant chord using 7 chords—C, D, E, F, G, A, and B as a major triad and C+, D+, E+, F+, G+, A+, and B+ as an augmented triad.
Procedure 3: MASQ questionnaire
In order to analyze the attitude and satisfaction of music listening, MASQ adapted the previous research. This questionnaire was divided into MASQ_General (MASQ_G) for the NH group and MASQ_Hearing loss (MASQ_H) for the HL group. In MASQ_H, basic information related to the HL group and hearing devices, satisfaction of music appreciation and each music component with hearing devices was added to the common questions presented to the NH group. Each question was consisted of 5 scales.
Procedure 4: MMN test
For the MMN test, 750 Hz and 2,000 Hz tone bursts were presented as a frequent stimulus and an infrequent stimulus, respectively. The total number of stimuli was 50 times, of which 20% consisted of the infrequent stimuli which were presented randomly. The collected responses were passed through a 1–30 Hz band-pass filter and recorded during the epoch time of 319.8 ms with no pre-stimulation recording interval. The stimuli were presented to the right and left ears via insert phone in the NH group at 70 dB. For the HAS group, the intensity of the tones attained at 70 dB to the ears with CI and 100 dB to the ears without CI through the headphone.
Data analysis
Statistical analysis was performed using SPSS program (Version 25: IBM Corp., Armonk, NY, USA). A repeated two-way analysis of variance with a Greenhouse-Geisser correction was used to compare among the six components of the AMP between the NH and HAS groups. An independent t-test was used to analyze the correction percentages in perceptual ability according to components of each testing item between the NH and HAS groups and paired t-test was performed within the groups. The level of significance for all statistical analyses was set at p<0.05.
Results
Speech audiometry
The SRTs were 5.0±4.2 dB HL and 1.7±5.2 dB HL for the right and left ears in the NH group. 49.6±12.7 dB HL and 57.5±11.5 dB HL for the right and left ears in the HAS group. The WRSs were 98.9%±2.4% at 48.3±5.6 dB HL and 99.5%± 1.4% at 46.7±5.2 dB HL for the right and left ears in the NH group and 66.3%±26.5% at 83.8±9.3 dB HL and 78.0%±12.5% at 85.6±7.3 dB HL for the right and left ears in the HAS group. When measured through the speaker after wearing HAS for the HAS group, 80.5%±14.9% was revealed.
Pitch perception test of AMP
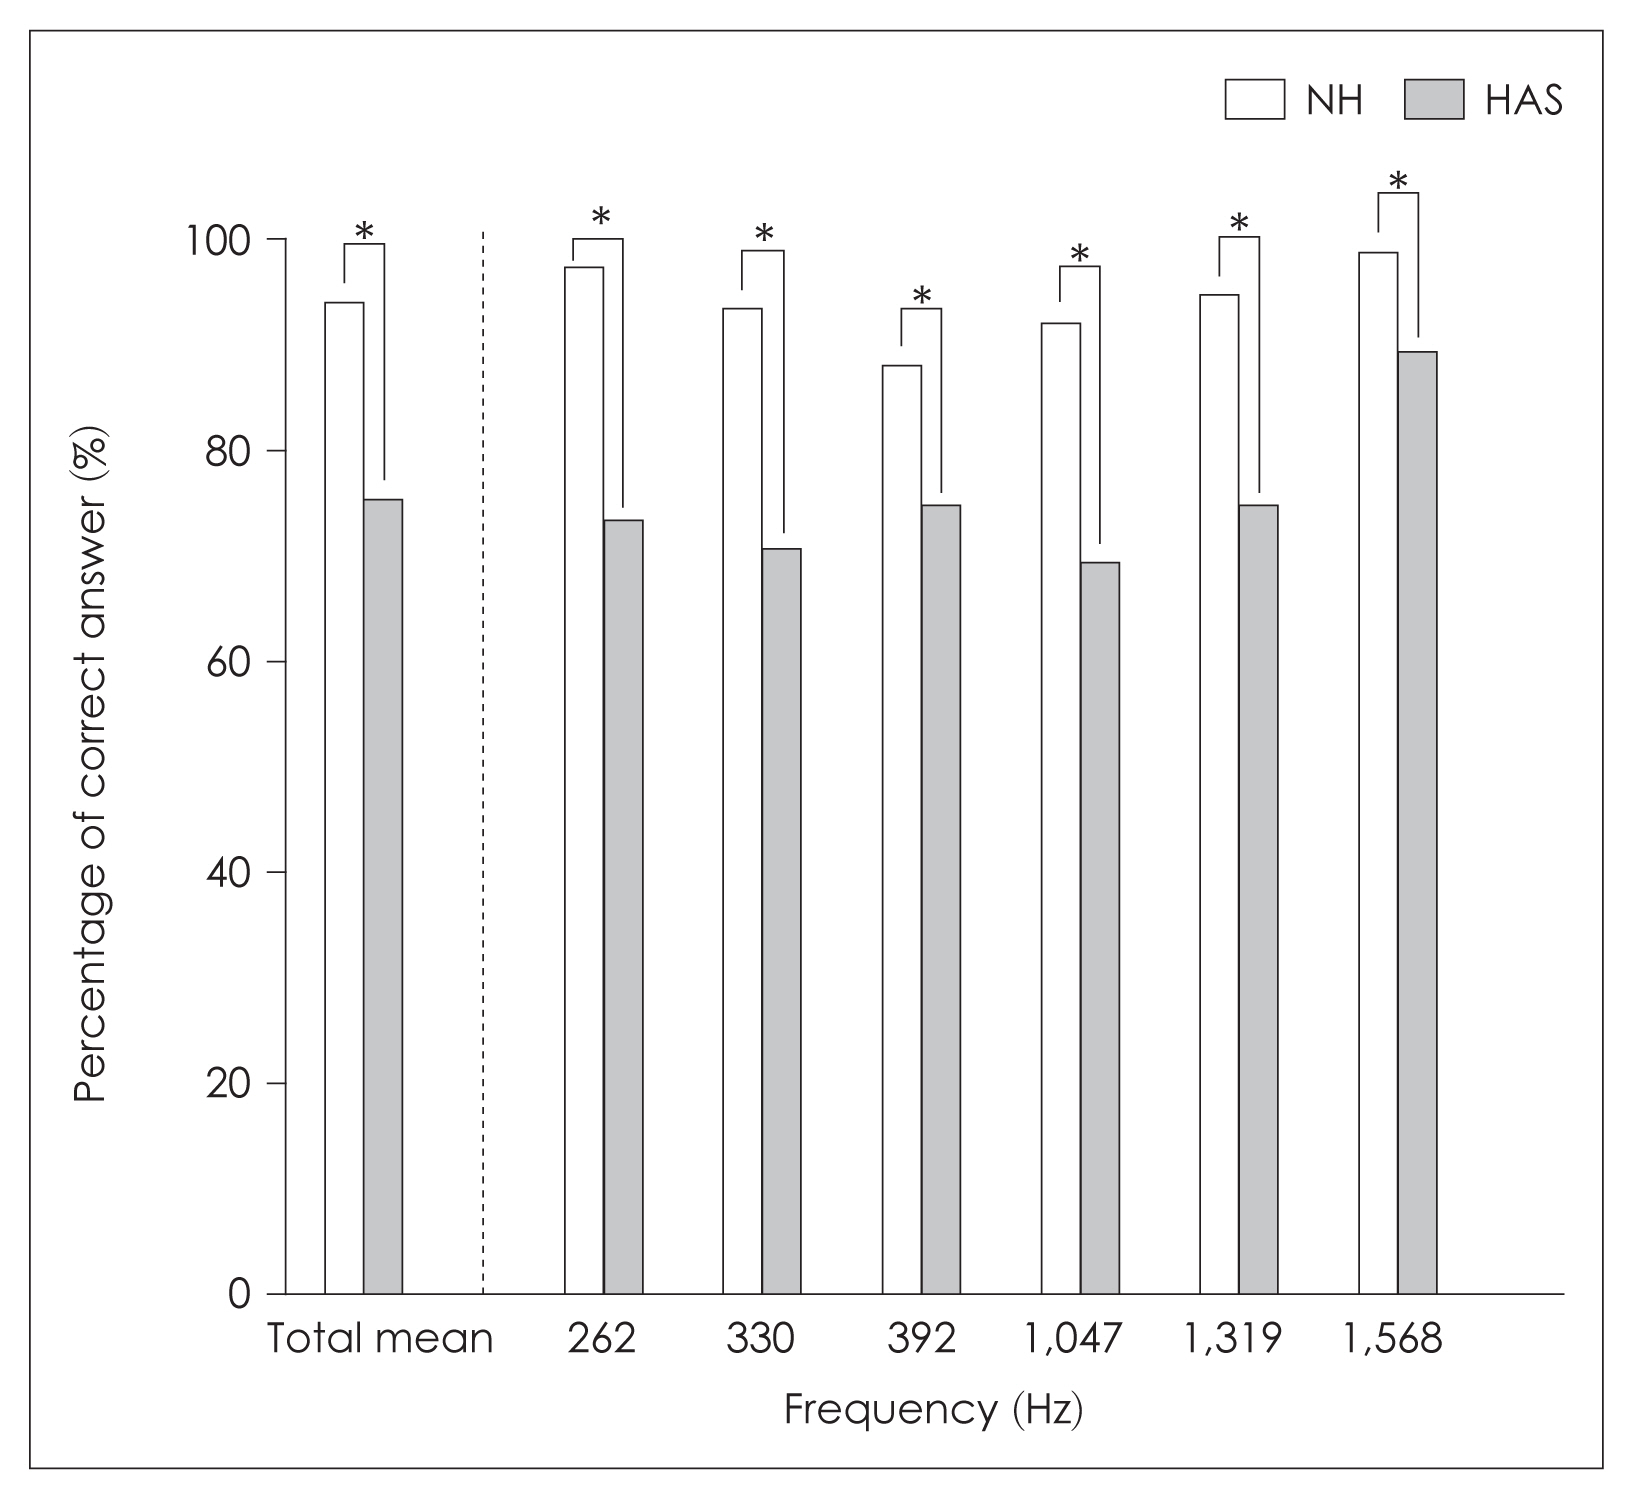
The correction percentages were 94.0%±6.1% in the NH group and 75.3%±23.2% in the HAS group with the statistical significance (F[1, 148]=31.935, p<0.05) (Fig. 1).
When divided into low frequencies including 262, 330, 392 Hz and high frequencies including 1,047, 1,319, 1,568 Hz, the performance in the NH and HAS groups were 92.9%± 25.8% and 72.9%±44.6% at low frequencies, 95.1%±21.6% and 77.8%±41.7% at high frequencies, without statistical significance (p>0.05).
Melody perception test of AMP
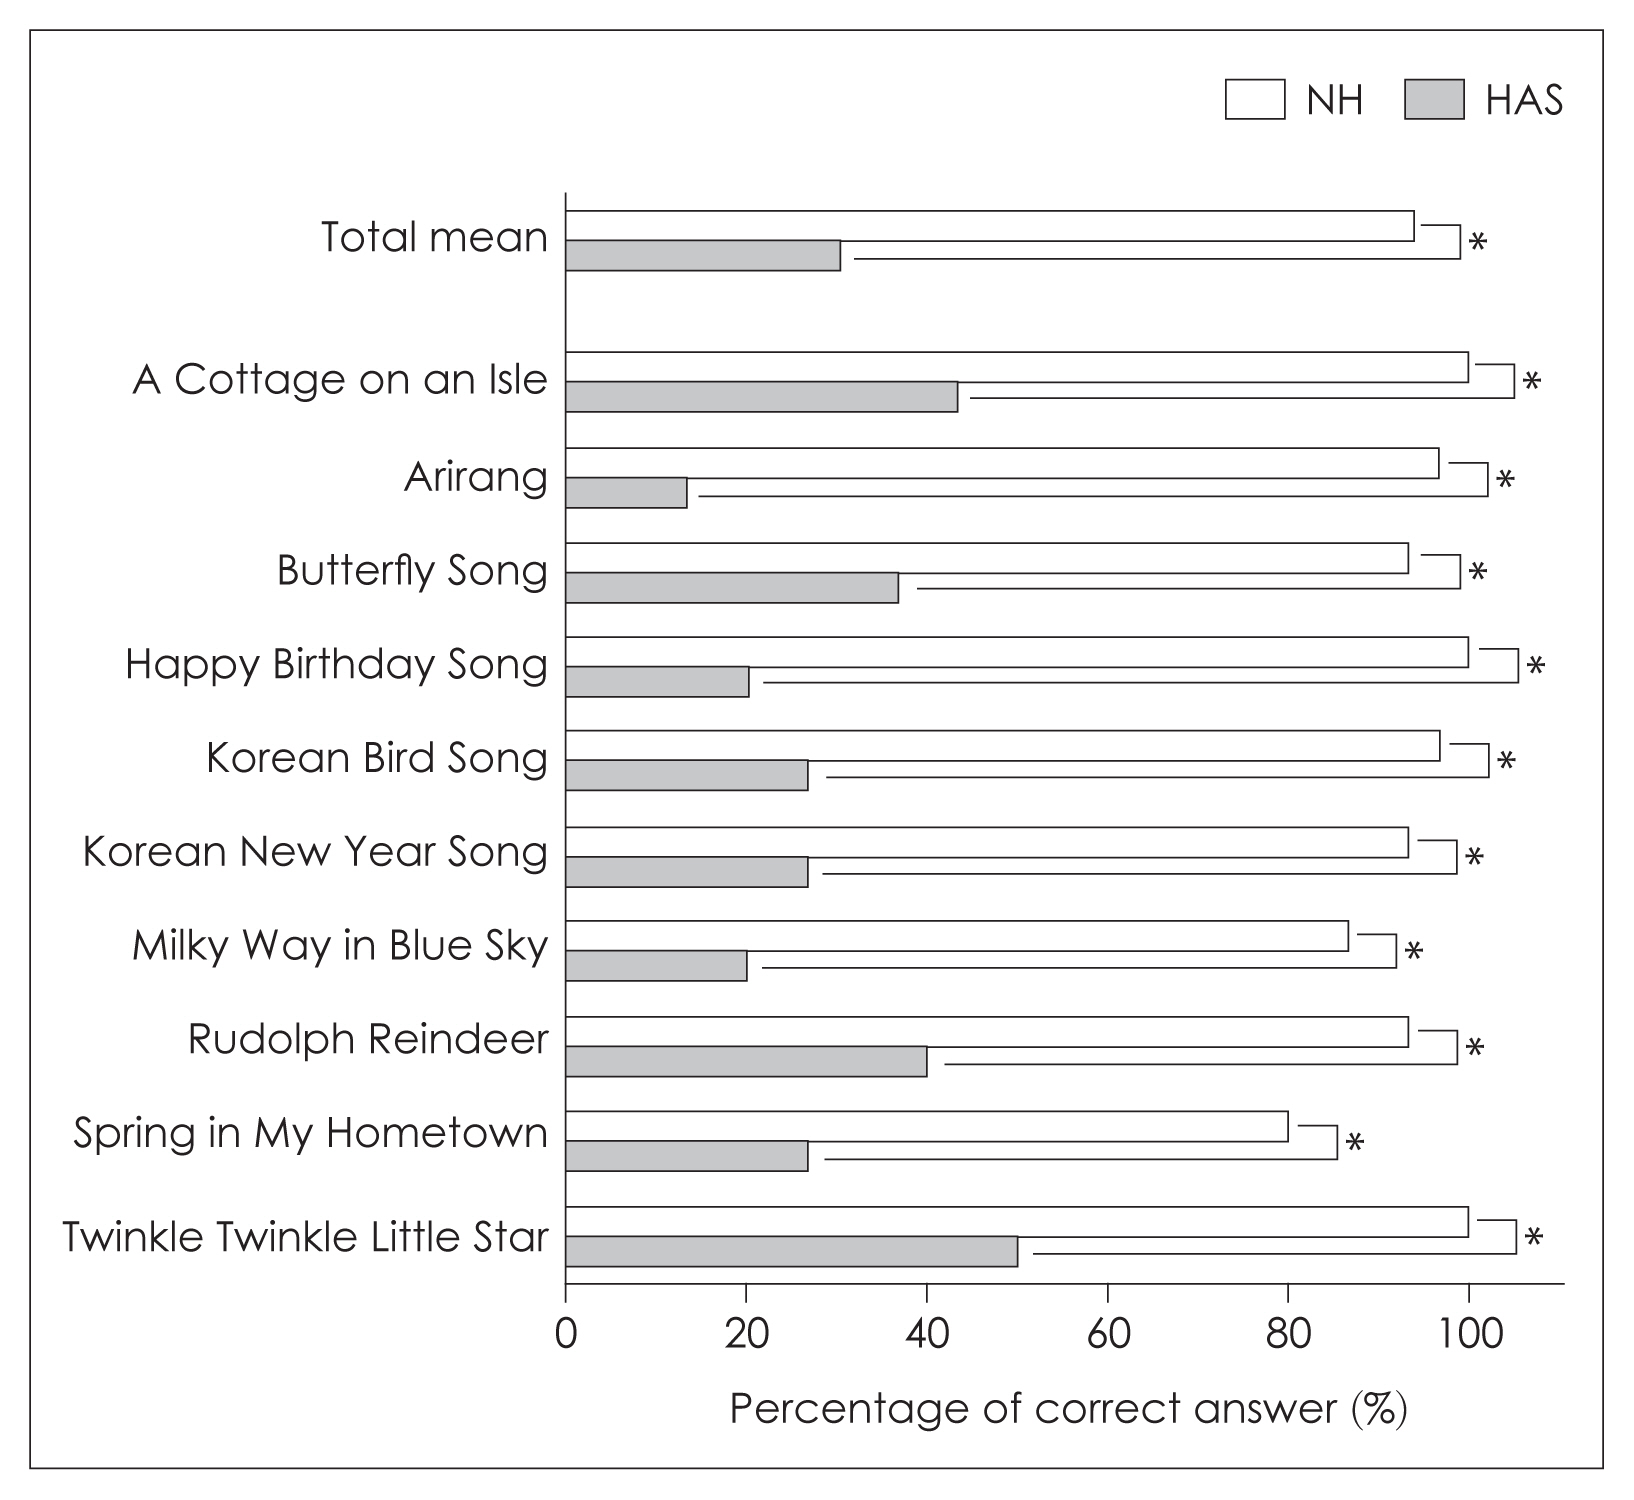
The correction percentages were 94.0%±7.1% in the NH group and 30.3%±25.9% in the HAS group with statistical significance (F[1, 58]=145.6, p<0.05). The highest score of 100% was obtained at “Happy Birthday Song,” “A Cottage on an Isle,” and “Twinkle Twinkle Little Star,” and the lowest score of 80% was obtained at “Spring in My Hometown” for the NH group. The HAS group showed the highest score of 50% with “Twinkle Twinkle Little Star” and the lowest score of 13.3% with “Arirang” (Fig. 2)
Rhythm perception test of AMP
The correction percentages were 99.3%±1.8% and 94.0%± 7.6% in the NH and HAS groups with statistical significance (F[1, 58]=10.728, p<0.05). The discrimination ability for each rhythm pattern between the NH and HAS groups showed significantly higher or same performance in the NH group without statistical significance (p>0.05).
Timbre perception test of AMP
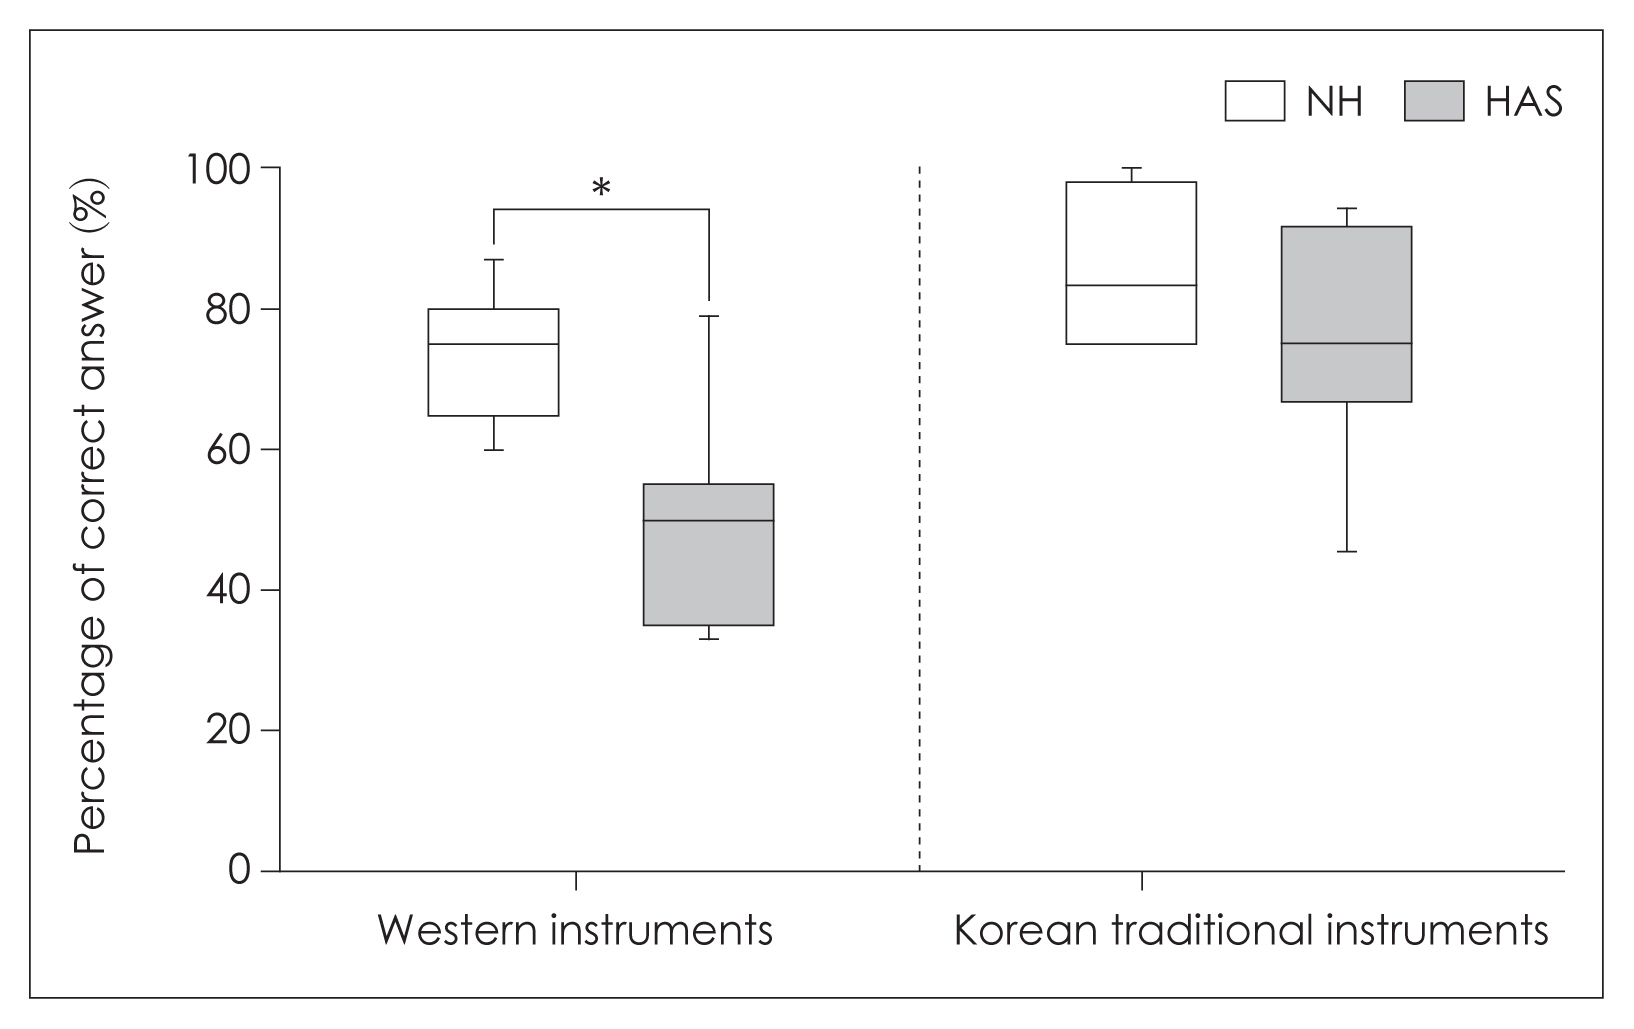
The correction percentages were 78.9%±41.8% and 64.4%±48.9% in the NH and HAS groups with statistical significance (F[1, 28]=13.615, p<0.05). When divided into western and Korean traditional musical instruments, the NH and HAS groups answered correctly 73.3% and 49.3% in western instruments with statistical significance (F[1, 58]=37.249, p<0.05) and 84.4% and 79.4% in Korean traditional musical instruments without statistical significance (F[1, 58]=1.996, p>0.05). For both the NH and HAS groups, Korean traditional musical instruments recorded higher perception ability for timbre test (Fig. 3).
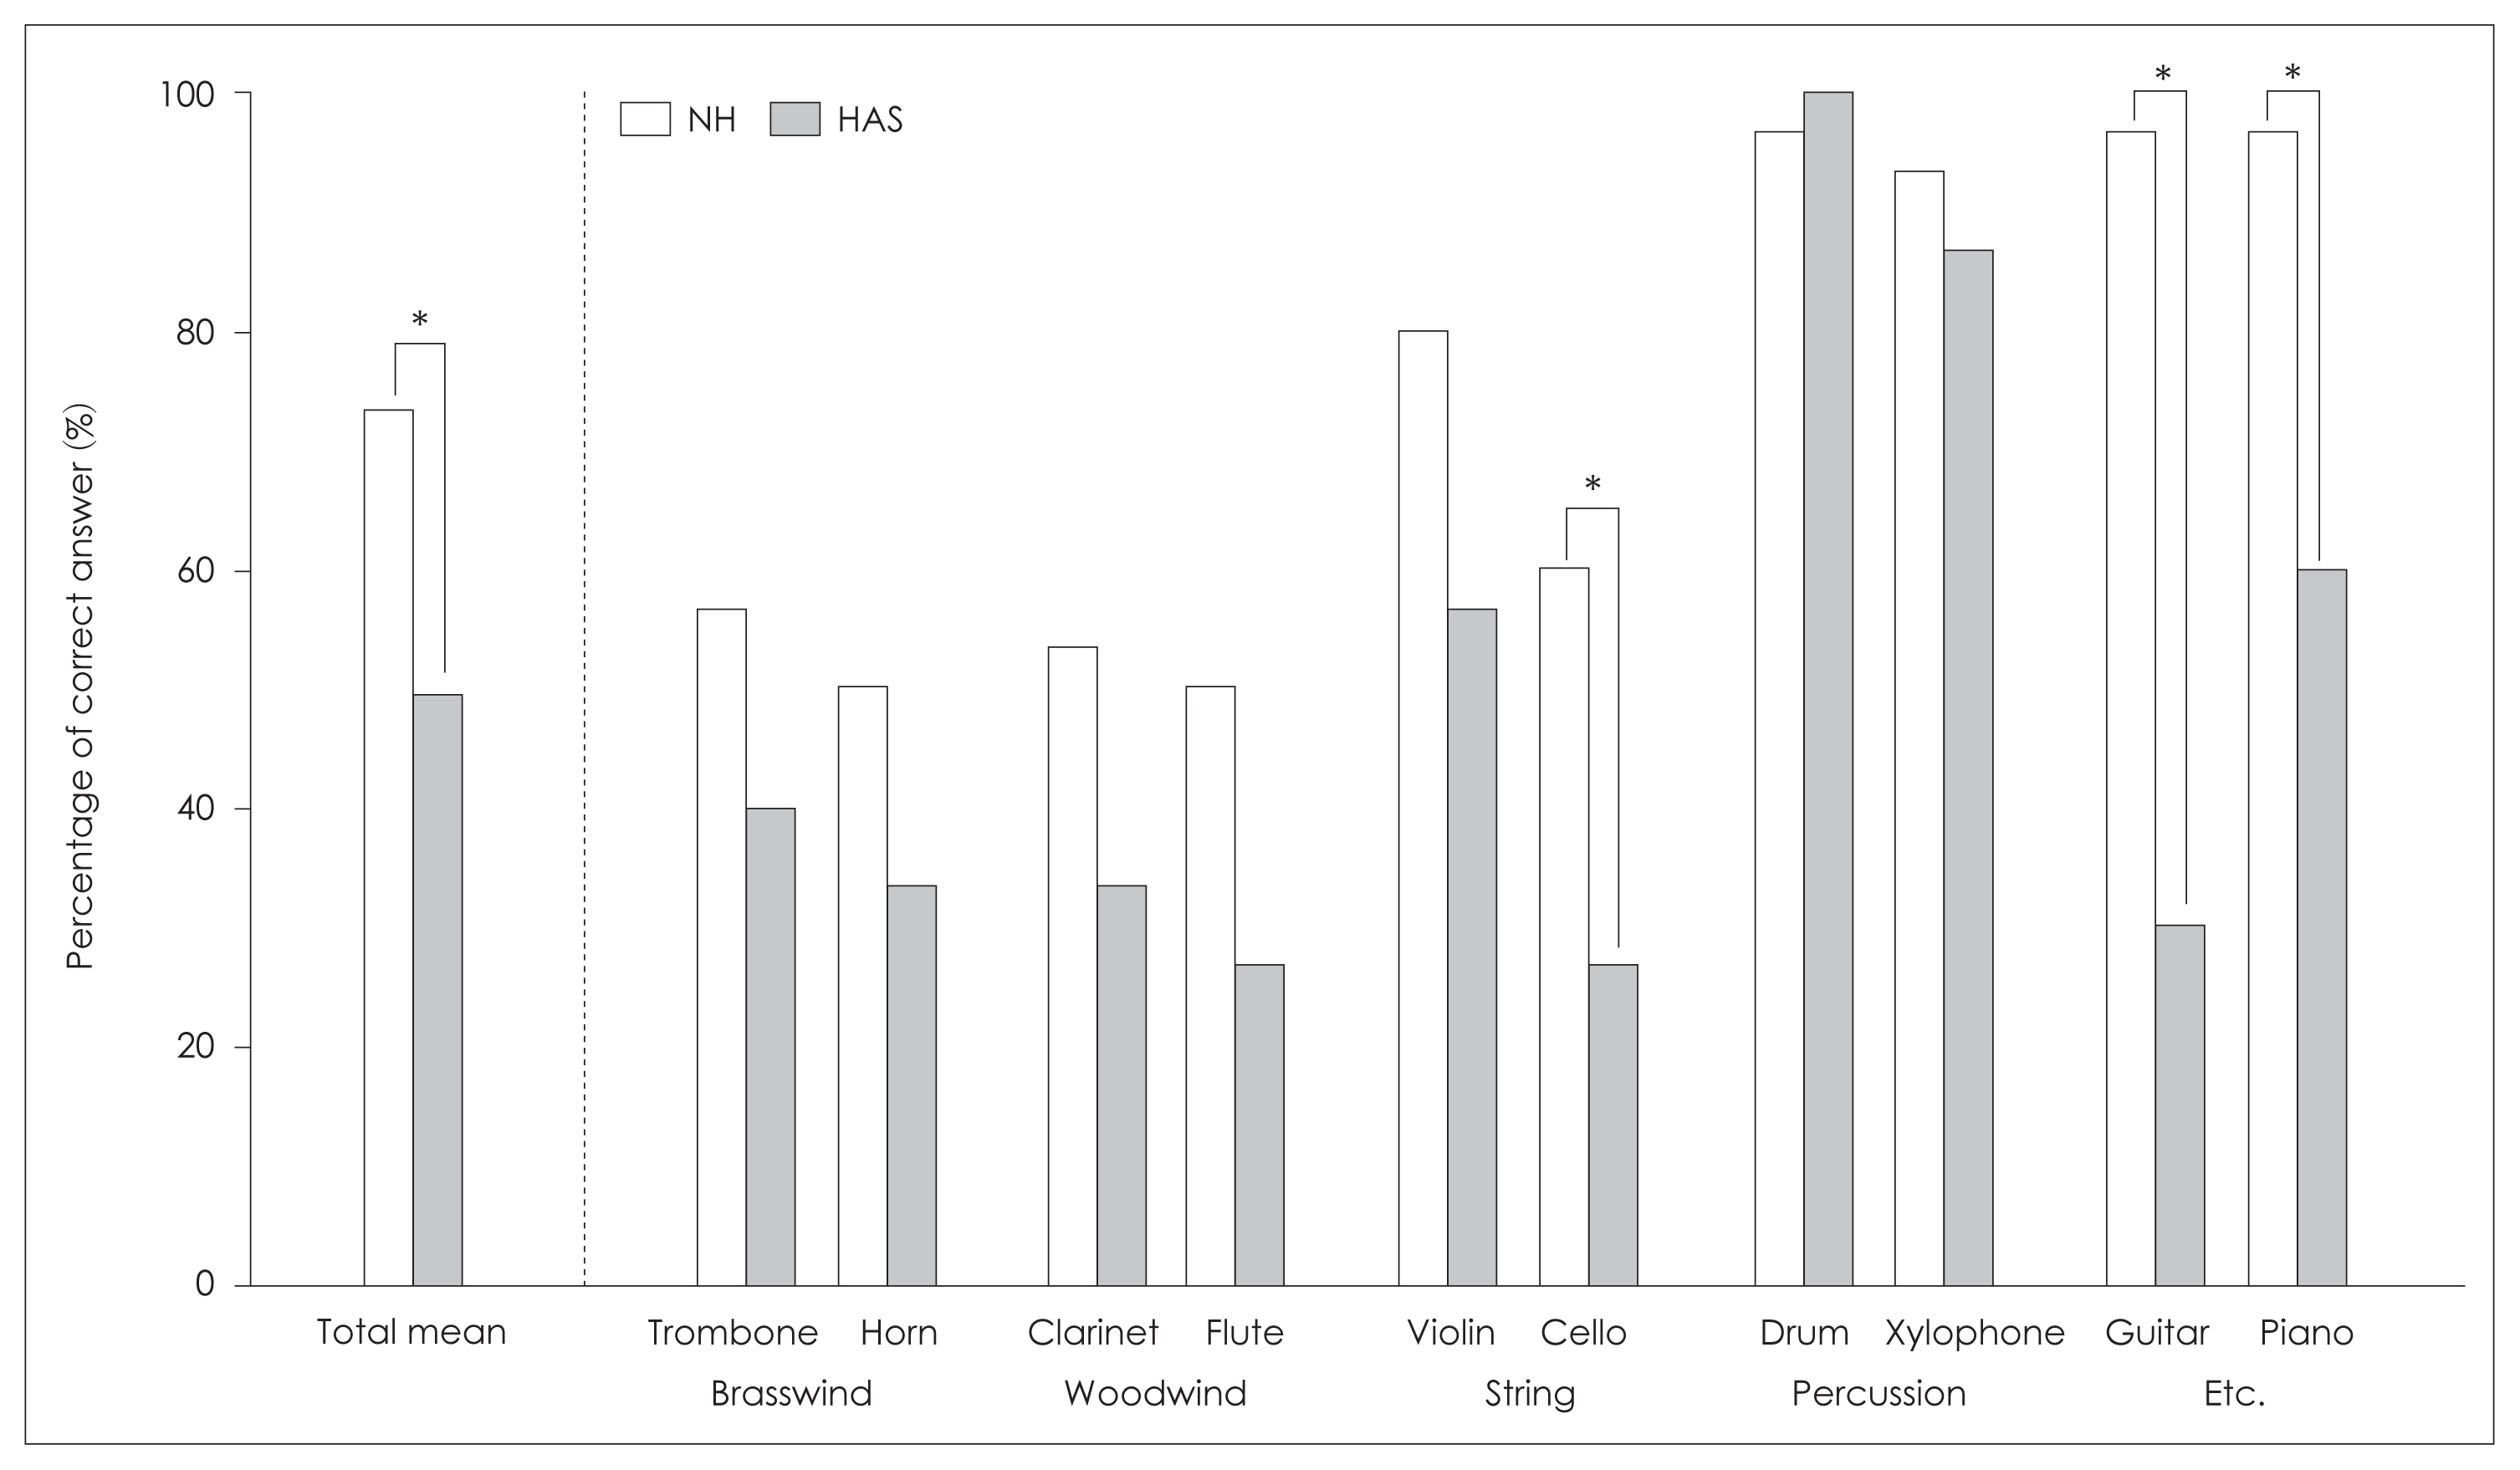
The NH group obtained the highest score at drum, guitar, and piano with 96.7% and the lowest score at horn and flute with 50%. For the HAS group, the highest score of 100% was obtained at drum and the lowest score at flute and cello with 26.7%. All western musical instruments except drum produced the higher scores in the NH group than the HAS group (p<0.05). The post hoc analysis using Bonferroni showed significant difference between violin-cello and guitar-piano pairs (p<0.05) (Fig. 4).
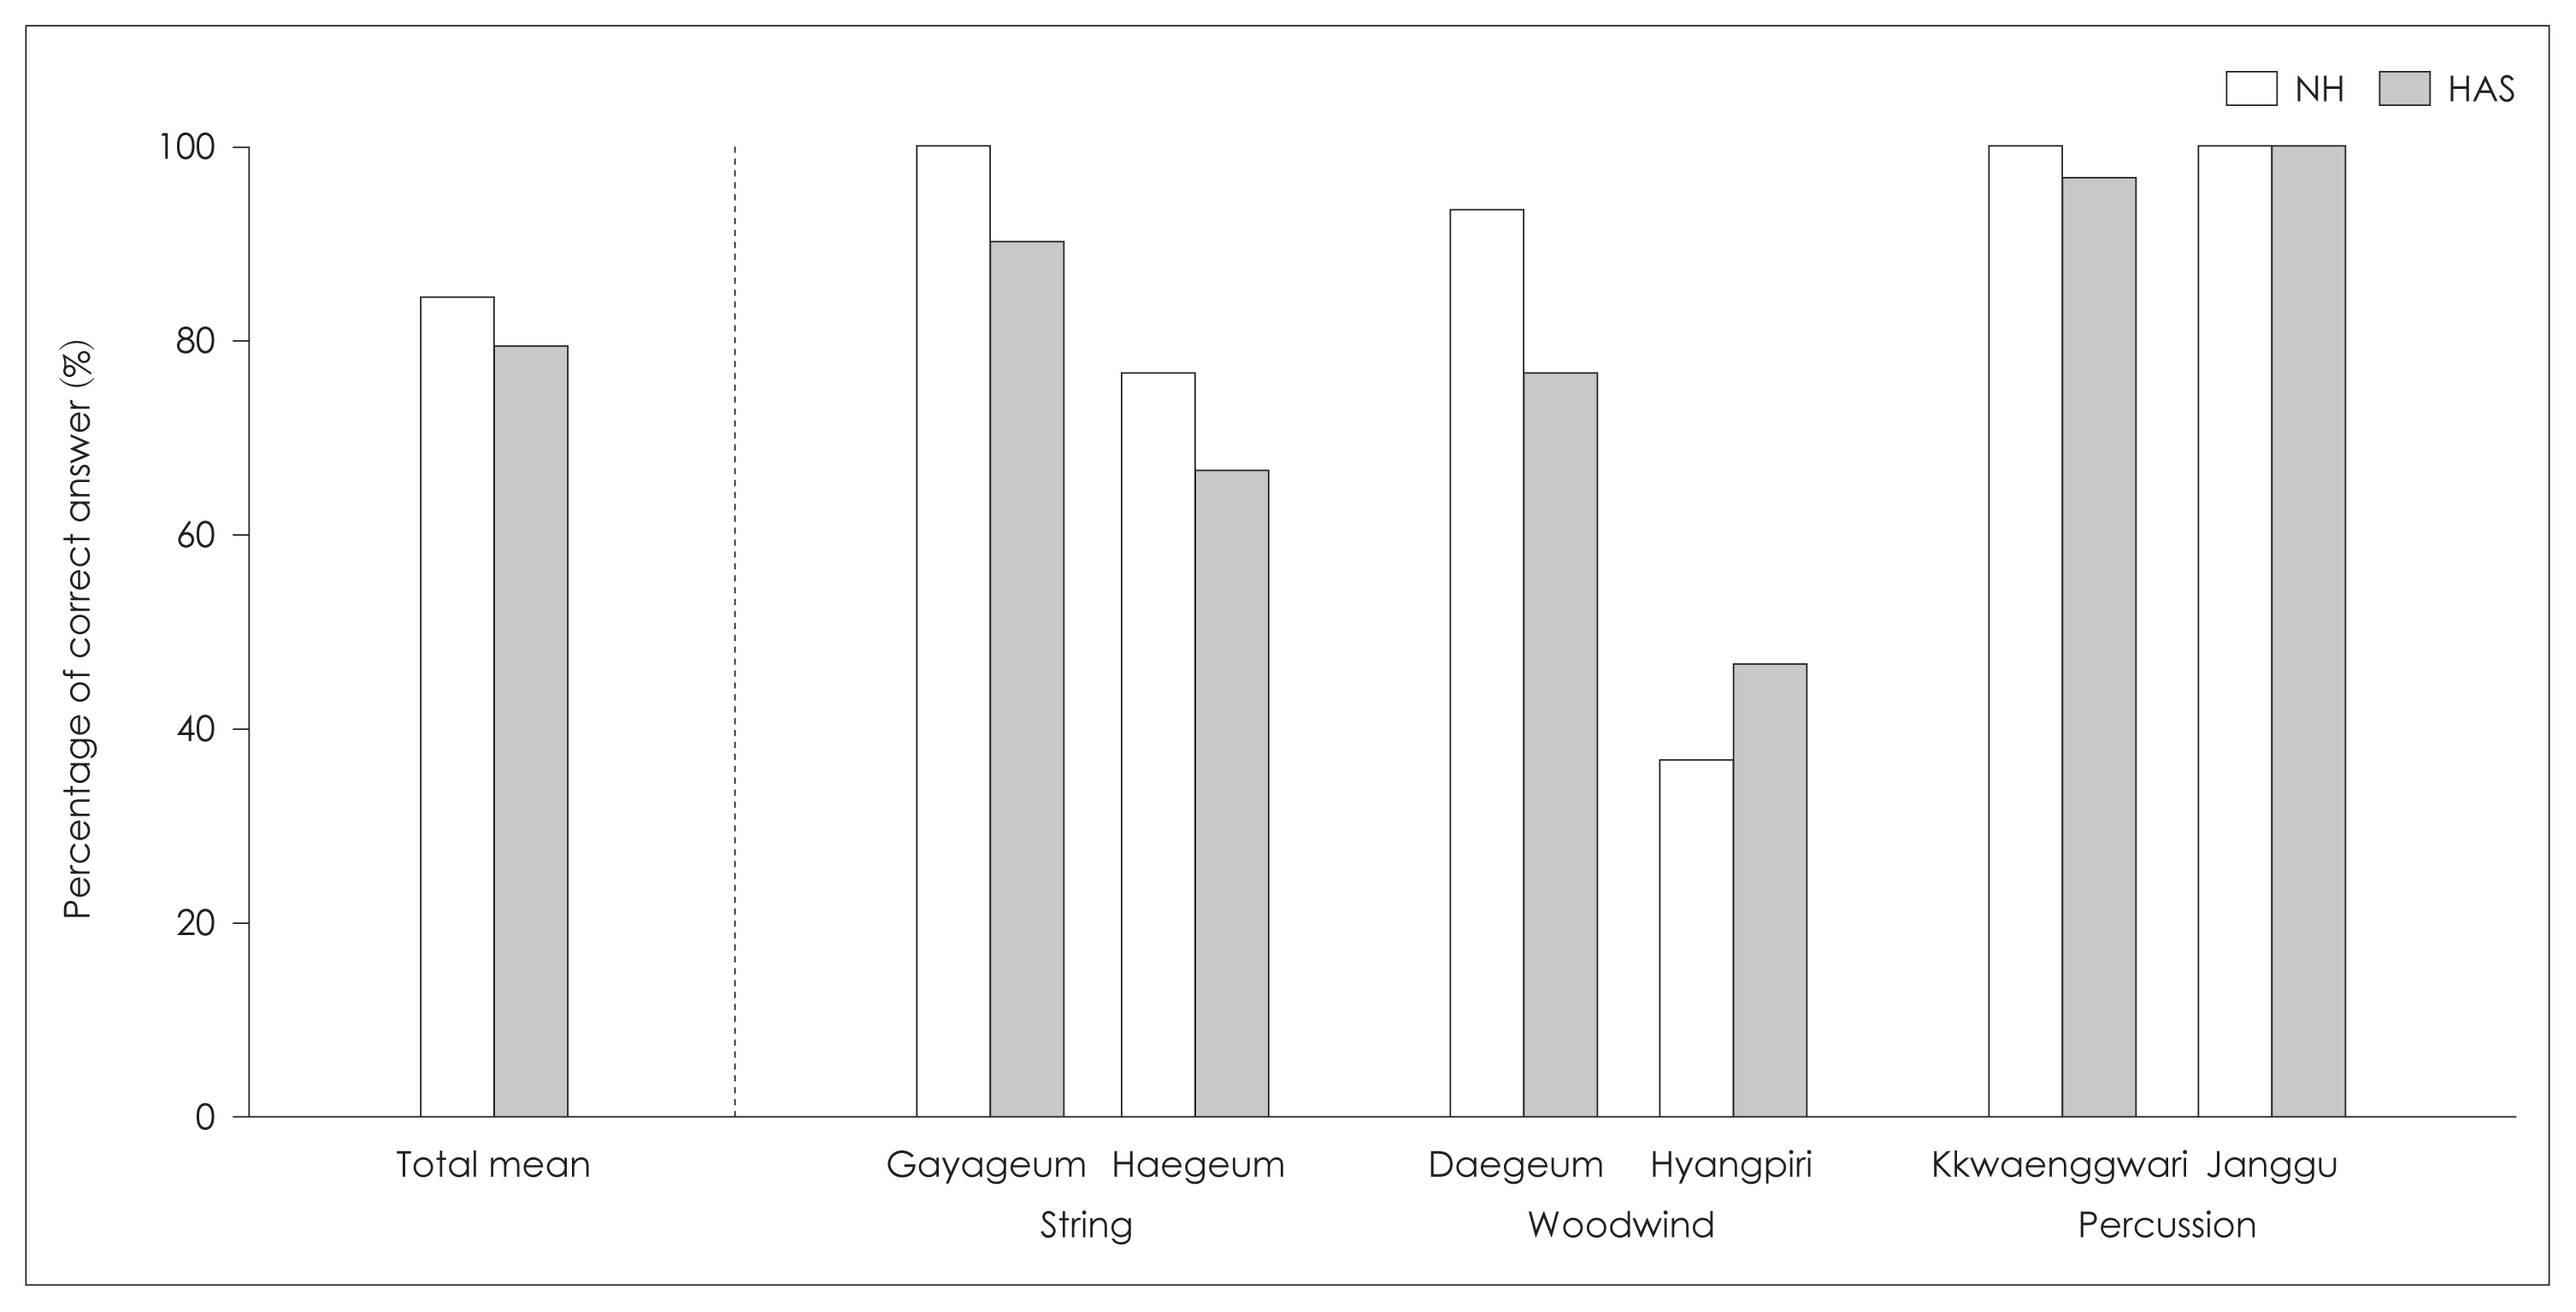
The highest score was obtained at gayageum, kkwaenggwari, and janggu with 100% and the lowest score at hyangpiri with 36% for the NH group. For the HAS group, the highest score of 100% was obtained at janggu and the lowest score of 46.7% was obtained at hyangpiri. Although the significant difference was not found between the NH and HAS groups, the NH group showed higher score in timbre perception test for Korean traditional musical instruments (Fig. 5). The post hoc analysis of using Bonferroni showed significant difference between gayageum-haegeum and daegeum-hyangpiri pairs (p<0.05).
The western and Korean musical instruments were classified following common categories such as woodwind, string, and percussion and the performance was compared between the NH and HAS groups. For those categories, the correction percentages were 78.6% and 67.2% showing significantly lower performance in the HAS group (F[1, 238]=14.943, p<0.05). For both the NH and HAS groups, the highest and lowest scores were observed for percussion and woodwind (p<0.05) (Table 2). The post hoc analysis using Bonferroni showed significant difference between woodwind-string, string-percussion, and woodwind-percussion pairs (p<0.05).
Emotional reaction test of AMP
The correction percentages were 96.7%±10.4% and 81.7%±16.3% in the NH and HAS groups with statistical significance (F[1, 28]=10.549, p<0.05). When comparing the performance according to bright and dark emotions, the scores were 96.7%±18.1% for both emotions in the NH group and 78.3%±41.5% and 85.0%±36.0% in the HAS group. The correction percentage for each song between the NH and HAS groups indicated lower performance in the HAS group with statistical significance (p<0.05).
Harmony perception test of AMP
The correction percentages were 85.7%±14.1% and 58.4%± 13.9% in the NH and HAS groups with statistical significance (F[1, 88]=50.344, p<0.05). For the NH group, the highest score of 88.9% was obtained at C, D, and F and the lowest score of 80% was obtained at G. For the HAS group, the highest score of 71.7% was obtained at F and the lowest score of 46.7% was obtained at C. The perception ability of each harmony between the NH and HAS groups showed the significantly higher performance in the NH group (p<0.05).
MASQ
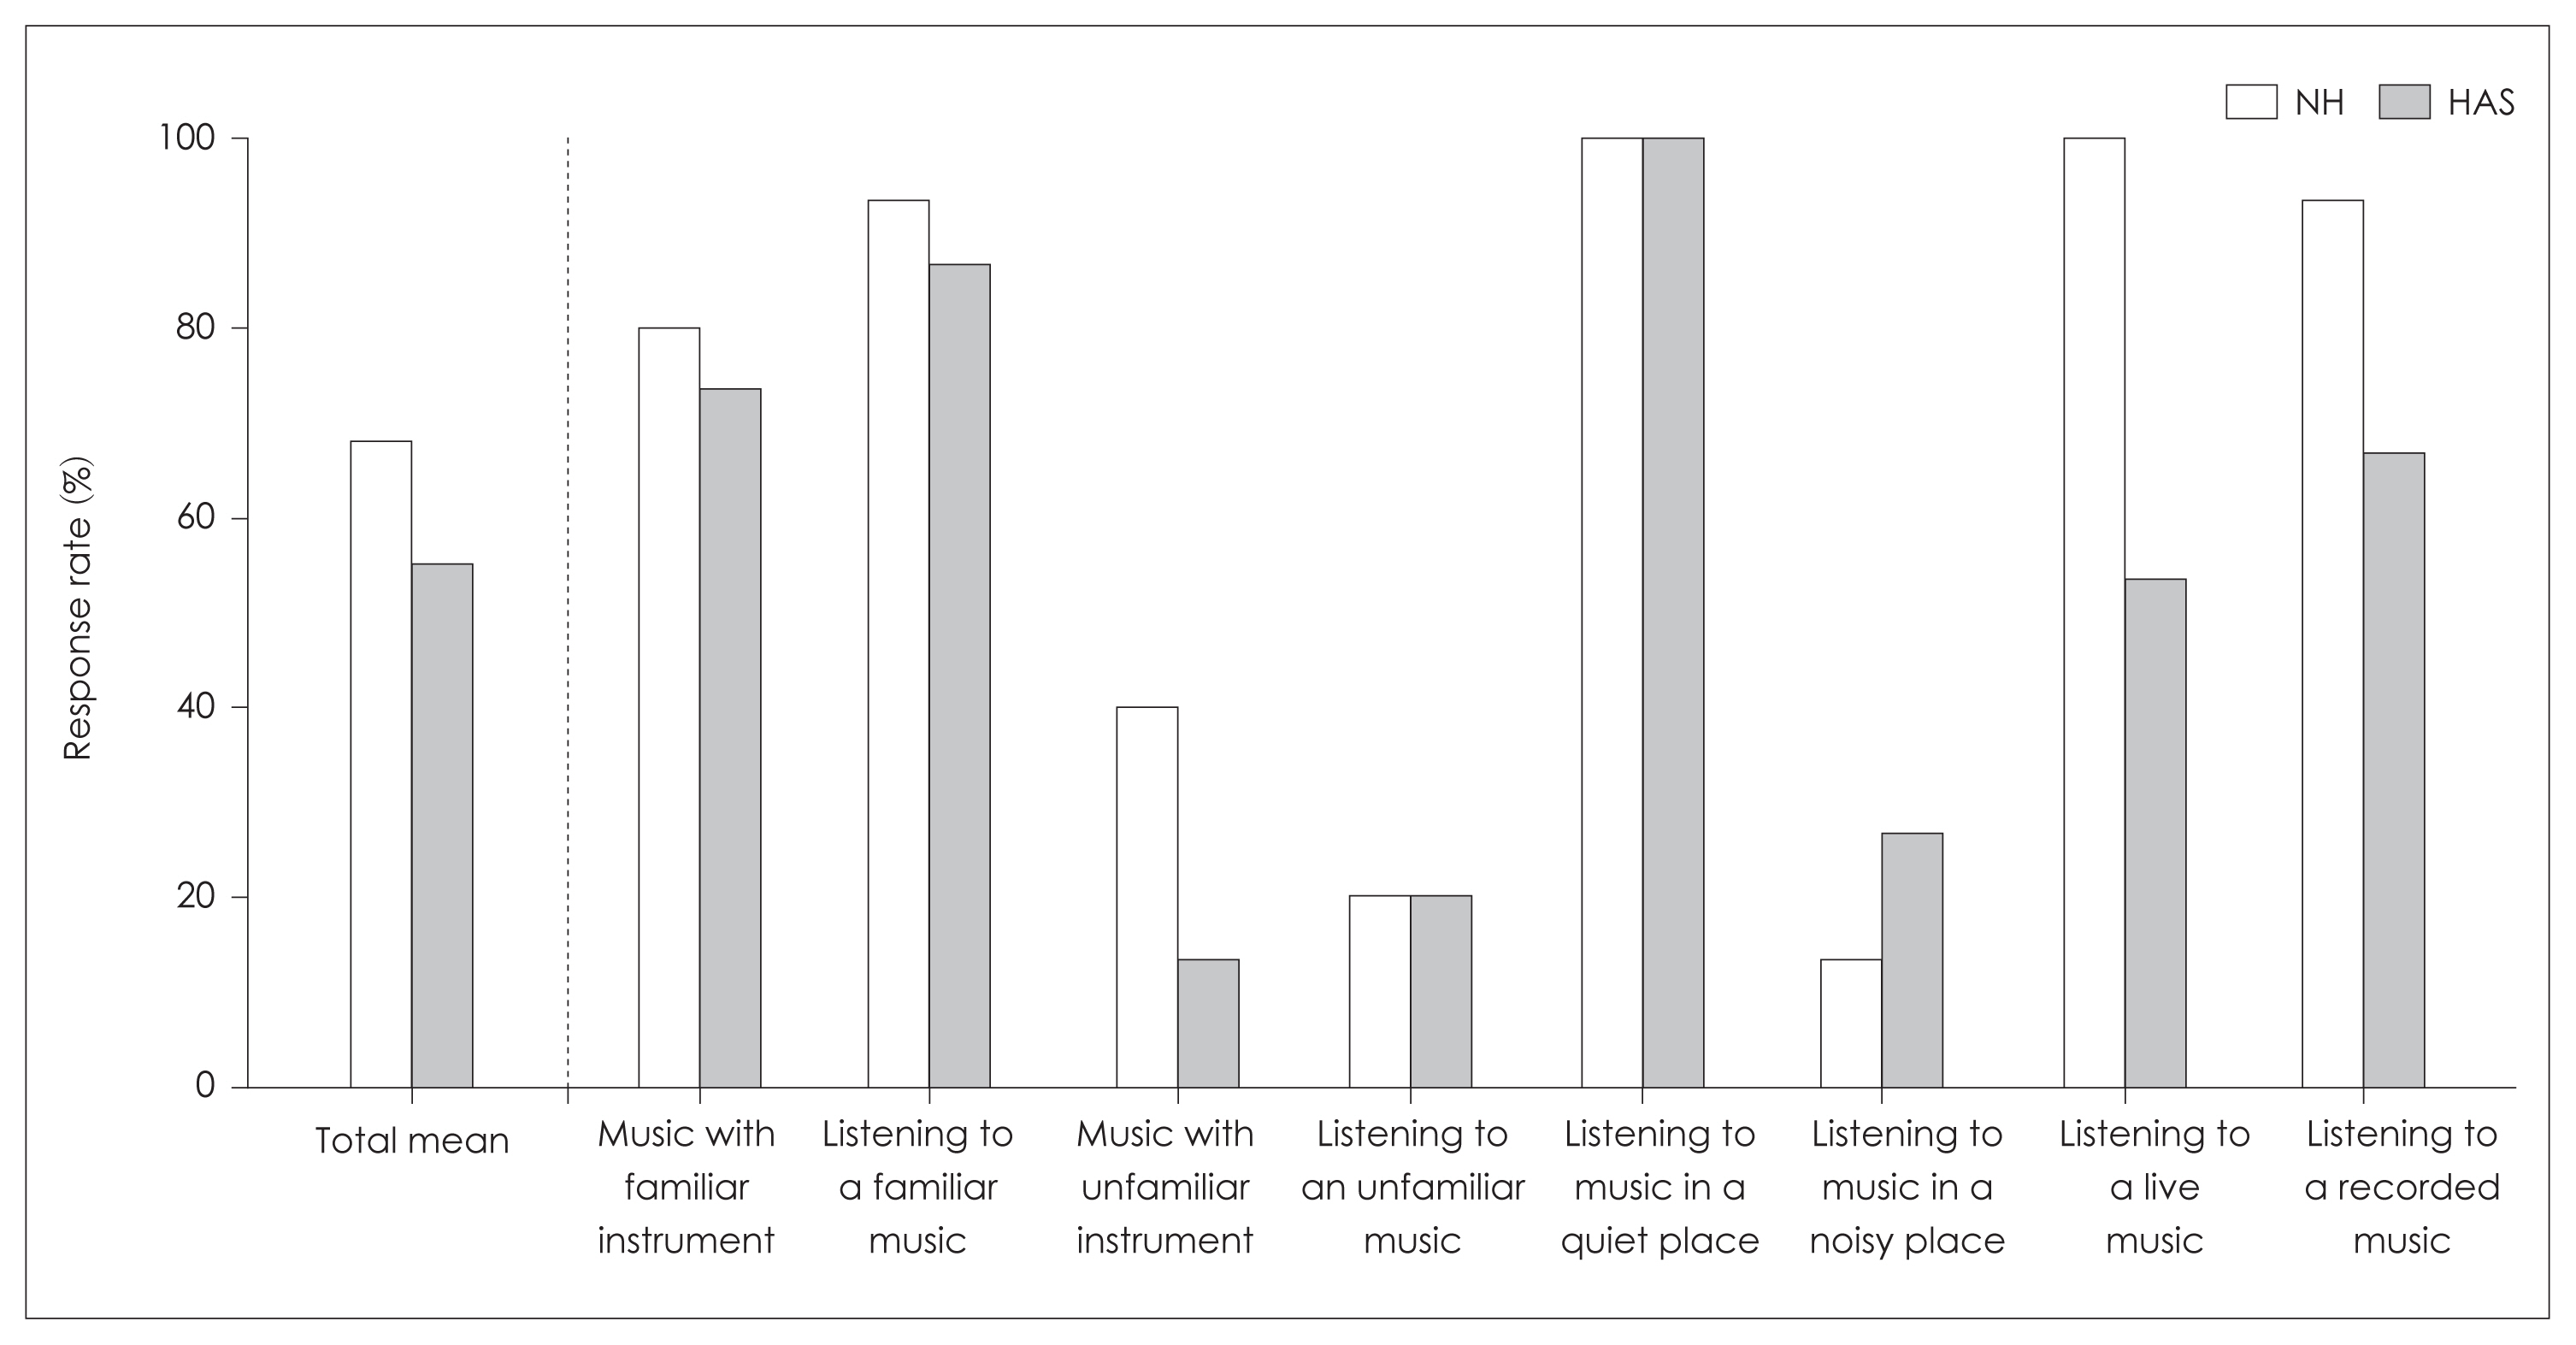
The general usual attitude for music appreciation was asked with the MASQ survey. The response rates of frequency for listening to music were 80% and 93.3% for the NH and HAS groups. The rates of preference voice of the music in the NH and HAS groups were 33.3% and 53.3% for female and 53.3% and 46.7% for male. Also, when asked about the preference for the number of voices, “Solo” was the highest rate among others (2–3 people, 3–5 people) for both the NH and HAS groups with 53.3% and 80%. When asked about the preference for the musical instrument sound, the NH and HAS groups replied that they preferred piano and drum. When asked about the preference for the number of instruments, 3 to 5 and 2 to 3 showed the highest identical rate for the NH and HAS groups with 40% (Fig. 6).
MMN
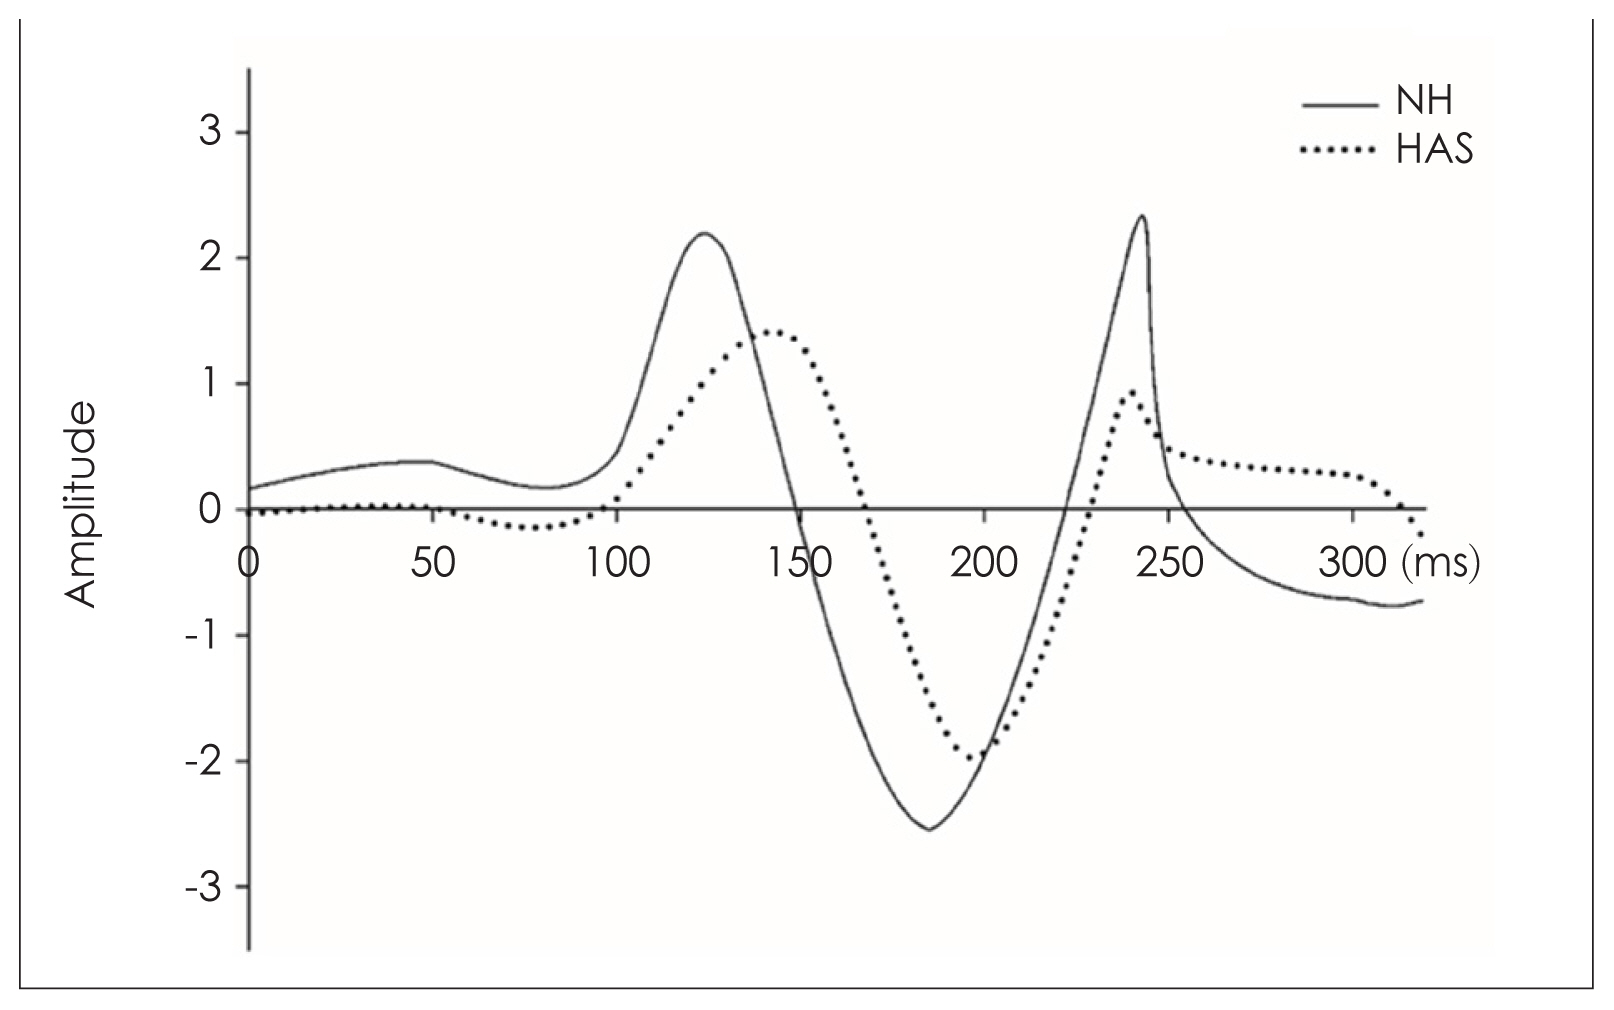
The areas of MMN waveform were 270.52 μV·ms and 280.02 μV·ms for the right and left ears without statistical significance (p>0.05) in the NH group. For the HAS group, the areas of MMN waveform were 189.91 μV·ms at 70 dB to the ears with HAS and 242.35 μV·ms at 100 dB to the ears without HAS showing no statistical significance (p>0.05).
The area of the MMN waveform depending on the NH and HAS groups showed 275.27 μV·ms and 189.91 μV·ms in the NH and HAS groups without statistical significance (p> 0.05) (Fig. 7).
Discussion
All of the music perception tests were higher in the NH group than the HAS group. In the pitch and emotional reaction tests, the NH group showed 94.0% and 96.7% with the small difference of 15%–18% from the HAS group. The HAS group showed the lowest score in melody test and the highest score in rhythm test. Interestingly, the NH and HAS groups showed similar scores with 99.3% and 94.0% in the rhythm test. Both the NH and HAS groups showed relatively low performance in timbre and harmony tests.
In the pitch perception test, the HAS group recorded significantly lower score than the NH group. When comparing low and high frequencies, several previous researchers reported that the low frequency perception was more sensitive [4,18]. However, in this study, when analyzed using post hoc of Bonferroni, only 1,568 Hz showed a particularly high correction percentage. Other than that, it is noted that there was almost no difference between the frequencies for the pitch perception.
The melody perception of the HAS group was revealed the lowest performance (30%) among pitch, rhythm, timbre, and harmony perception tests and this outcome was in agreement with the previous studies [4,19]. This was also supported by [12] in his study finding that the CI group correctly identified the melody on average of 25.1% showing lower than timbre test (45.3%). The melody identification was related with the pitch perception ability and the residual hearing, allowing some of the lower frequency fine-structure cues to be perceived [20]. And the preserved residual hearing can make responding to acoustic stimulation, which affect the melody perception accuracy [21]. Wearing bimodal with CI and HA performed better than wearing only CI in the melody perception test [21], was also proved in this study showing significantly higher performance at 90% with wearing hybrid participants who had relatively lower thresholds as 30 dB with low frequency.
The HAS group showed good performance (94%) in the rhythm perception test which was comparable to performance of the NH group (99.3%). This results were already demonstrated through several previous studies [4,22,23]. The rhythm perception seemed to be affected by the CI processing that preserved and transmitted the rhythmical information to isochronous changes on milliseconds of rhythm by capturing temporal envelope cues of acoustic signals [24].
In the timbre perception test, the NH group recorded the lower scores due to less exposure to various musical instruments during childhood. Also, timbre identification was one of the most challenging elements among others to the HAS users because precise perception of the timbre requires understanding of both temporal envelope and spectral fine structure of the certain musical instrument. Interestingly, when compared the musical instrument quality ratings between Ineraid and Nucleus CI users, Ineraid users felt more pleasant with every instrument sound quality than Nucleus [22]. The wideband filter processing of Ineraid would be more suitable strategy to music listening than Nucleus which emphasized speech feature extraction coding strategy. In the light of the common categories of the musical instruments, the scores were the highest in percussion, then strings and woodwind were followed for both groups in this study. Except percussion that showed the outstanding perception ability for both the NH and HAS groups in western and Korean traditional musical instruments due to its peculiar sound characteristics, the highest score was revealed with the piano and violin at the HAS group, piano and guitar at the NH group. Familiarity with piano, violin, and guitar that were usually heard in daily lives might have influenced. Also, both groups answered that piano was favorite musical instrument in MASQ_H questionnaire. This was consistent with the previous studies that showed the highest score with piano and guitar in the CI group [4,7,12,18]. Timbre perception test of the most Korean traditional instruments was higher than Western instruments for both groups. HAS user reported that it was easy to select the Korean traditional instruments due to the uniqueness of the sound. To summarize, the ability to perceive the timbre depended on the peculiar musical characteristics and the musical experience.
HAS group showed lower performance (81.7%) than the NH group (96.7%) in most of the songs in the emotional reaction test. The HAS’s performance was relatively high comparing to the previous study [25]. The difference might have caused by the participants. The participants of the previous study were deaf who shared a sign language and did not have the opportunity to enjoy the music in daily lives. In MASQ_ H, the 93.3% enjoyed the music in the HAS group. That is, although HAS users in this study had difficulty in perceiving the music by each component, they may have felt and enjoyed the emotions contained by the music in daily lives. The slight low performance at the HAS group in this study was probably due to the HL leading them to perceive different emotions even when listening to the same music. Pitch and tempo are the essential cues to perceive the emotion of perception of the music. The HAS users showed lower scores in the emotional perception, as they depend on the tempo rather than pitch cues to detect the music’s emotion while the NH utilized both signals [26,27].
Harmony perception of HAS and NH groups showed relatively lower performance when compared with other tests. In the NH group, the performance tended to get lower as the sound became up from C (88.9%) to G (80%). However, when the HAS group was asked how much difference could be felt, they answered that the consonance and the dissonance were difficult to distinguish. This was consistent with the previous study suggesting that the NH group felt unpleasant with pitch changes from consonant to dissonant but the CI group felt similar to all musical passages regardless of consonance or dissonance levels [28].
There was no difference between the NH and HAS groups in the MMN test. But the poor sensitivity to detect acoustical change in HAS group might have affected the slightly decreased area of the MMN waveform in this study as the previous study proved [8]. No significant difference was found between with and without HAS in the HAS users showing no physiological difference for musical perception abilities depending HAS in the hearing impaired.
Our study proved that frequency of music appreciation in HAS users was high, which 93.3% of the HAS group answered “yes” when asked whether they enjoyed the music frequently in MASQ_H questionnaire. However, the HAS group tended to have time for listening to music when they were not disturbed by the ambient noise proving that HAS users generally had difficulty of sound perception in noisy environment due to lack of attentional selectivity [29]. Regarding the preference of voice, female voice (53.3%) was slightly higher with no significant difference from the male voice (46.7%), consistent with the previous study reporting 91.7% of preference of the female voice for the children with CIs [30]. This is possibly due to the fundamental frequency difference between male and female voices with 125 Hz and 220 Hz proving preference of the female voice [31,32]. Children and adults with CI showed high preference with less number of voices and instruments from the previous researches [30,33]. This is consistent with that the HAS group preferred solo (80%) overwhelmingly.
From the results of this study we can conclude that the music rehabilitation is necessary for the HAS users as they desire to enjoy the music and have capacity for embracing various musical characteristics. Because the high music appreciation rate in the HAS group was proved by the MASQ result showing that 80% and 93.3% of frequency for listening to music for the HAS and NH groups. Also, the HAS users felt ordinary when listened the unfamiliar instruments and unknown musical cords which not be obstacle factors for listening various musical instruments and cords to accustom.
Musical rehabilitation to the HAS users is for improving the overall music perception ability [34]. This also can be accomplished with brain plasticity. Brain areas associated with operating musical knowledge include moto cortex, auditory cortex and cerebellum [35]. Musical rehabilitation was discussed for improving top-down auditory processing and inducing brain plasticity at multiple of brain levels with complex musical stimuli and firm interrelationships between perception and performance [36]. After receiving musical training, participants learned to play the musical instruments, and anatomical changes in brain areas and structural alteration in the auditory system were observed [37]. The limitation of this study can be noted dividing into groups wearing CI, HA, and CI and HA bimodally as the number of subjects was not large enough to classify each group properly. In the future study, subjects should be classified into wearing CI, HA, and CI and HA groups to evaluate the effect of residual hearing and acoustical influence for music perception, accurately.
Conclusively, pitch, melody, rhythm, timbre, emotional reaction, and harmony can be elements for music rehabilitation program. For example, the rhythm perception can be trained at a similar level to the NH group. The melody perception with the lowest performance should start from the basic level for the music rehabilitation program as the melody perception was noted to be the difficult element. Recently, the research provided a good direction and fine effectiveness of music rehabilitation program for the HAS users [38,39]. A lot of this sort of reports would improve the quality of life for the HAS users including enjoyment of music.